 Question posted in

I’m running a WordPress-Woocommerce website on a VPS. My VPS configuration is as below:
- 4 Core CPU
- 8 GB RAM
- 40 GB NVMe
I’m running CentOS 7 + Cyberpanel + Openlitespeed Server + QUIC CDN + MariaDB.
- PHP version: 8.1
- MariaDB version 10.4.32
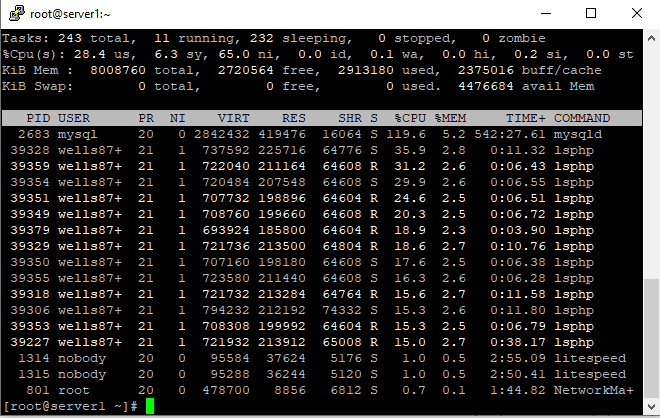
My CPU usage is always on the peak as shown below.
I tried running top command, and I found mysqld is consuming too much CPU as seen below.
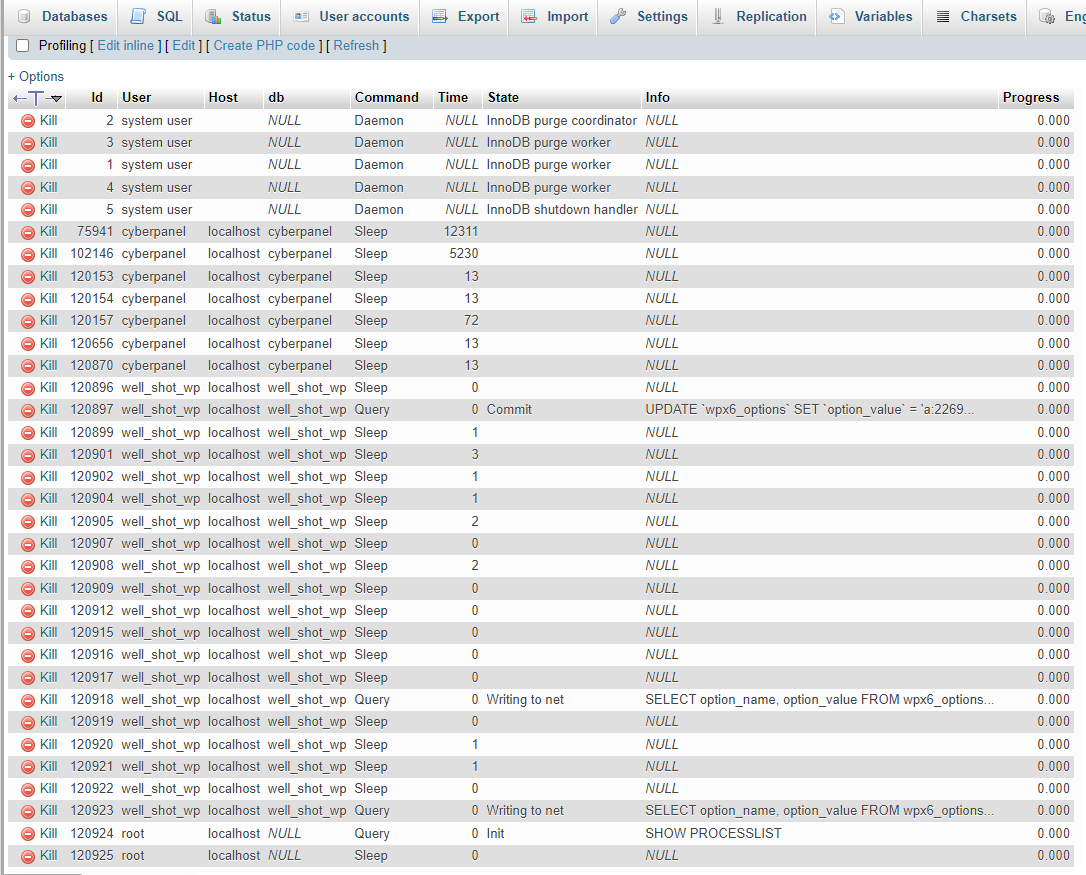
I ran SHOW PROCESSLIST; from phpmyadmin and found the following.
Now I’m stuck here. I tried googling a lot but I don’t understand how to overcome this. I’m not really very MySQL savvy. Please help. Thanks in advance.
I tried running top command, and I found mysqld is consuming too much CPU. I ran SHOW PROCESSLIST; from phpmyadmin and found there are lots of sleeping connections. Now I’m stuck there. I don’t why they’re there or how to get rid of them.
Update:
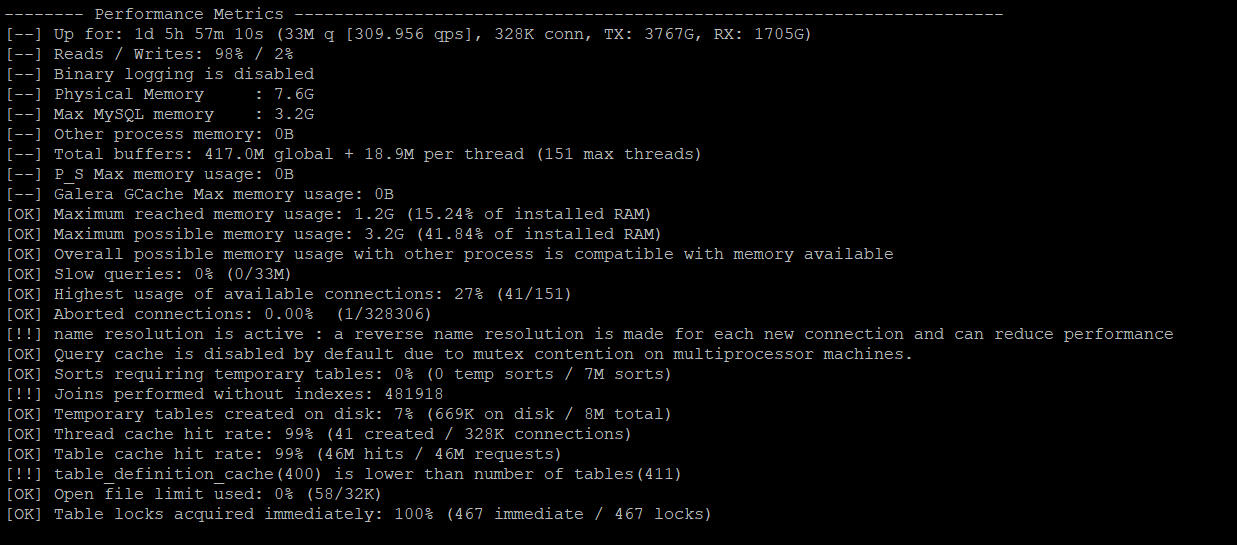
I tried running mysqultuner from ssh terminal. Here is the result:
[root@server1 ~]# mysqltuner
 >>  MySQLTuner 1.8.3 - Major Hayden <[email protected]>
 >>  Bug reports, feature requests, and downloads at http://mysqltuner.pl/
 >>  Run with '--help' for additional options and output filtering

[--] Skipped version check for MySQLTuner script
[OK] Currently running supported MySQL version 10.4.32-MariaDB
[OK] Operating on 64-bit architecture

-------- Log file Recommendations ------------------------------------------------------------------
[!!] Log file  doesn't exist

-------- Storage Engine Statistics -----------------------------------------------------------------
[--] Status: +Aria +CSV +InnoDB +MEMORY +MRG_MyISAM +MyISAM +PERFORMANCE_SCHEMA +SEQUENCE
[--] Data in InnoDB tables: 208.2M (Tables: 248)
[--] Data in MEMORY tables: 0B (Tables: 1)
[OK] Total fragmented tables: 0

-------- Analysis Performance Metrics --------------------------------------------------------------
[--] innodb_stats_on_metadata: OFF
[OK] No stat updates during querying INFORMATION_SCHEMA.

-------- Security Recommendations ------------------------------------------------------------------
[OK] There are no anonymous accounts for any database users
[OK] All database users have passwords assigned
[!!] There is no basic password file list!

-------- CVE Security Recommendations --------------------------------------------------------------
[--] Skipped due to --cvefile option undefined

-------- Performance Metrics -----------------------------------------------------------------------
[--] Up for: 1d 6h 18m 43s (33M q [309.726 qps], 332K conn, TX: 3811G, RX: 1724G)
[--] Reads / Writes: 98% / 2%
[--] Binary logging is disabled
[--] Physical Memory     : 7.6G
[--] Max MySQL memory    : 3.2G
[--] Other process memory: 0B
[--] Total buffers: 417.0M global + 18.9M per thread (151 max threads)
[--] P_S Max memory usage: 0B
[--] Galera GCache Max memory usage: 0B
[OK] Maximum reached memory usage: 1.2G (15.24% of installed RAM)
[OK] Maximum possible memory usage: 3.2G (41.84% of installed RAM)
[OK] Overall possible memory usage with other process is compatible with memory available
[OK] Slow queries: 0% (0/33M)
[OK] Highest usage of available connections: 27% (41/151)
[OK] Aborted connections: 0.00%  (1/332426)
[!!] name resolution is active : a reverse name resolution is made for each new connection and can reduce performance
[OK] Query cache is disabled by default due to mutex contention on multiprocessor machines.
[OK] Sorts requiring temporary tables: 0% (0 temp sorts / 7M sorts)
[!!] Joins performed without indexes: 488154
[OK] Temporary tables created on disk: 7% (677K on disk / 8M total)
[OK] Thread cache hit rate: 99% (41 created / 332K connections)
[OK] Table cache hit rate: 99% (46M hits / 46M requests)
[!!] table_definition_cache(400) is lower than number of tables(411)
[OK] Open file limit used: 0% (58/32K)
[OK] Table locks acquired immediately: 100% (472 immediate / 472 locks)

-------- Performance schema ------------------------------------------------------------------------
[--] Performance schema is disabled.
[--] Memory used by P_S: 0B
[--] Sys schema isn't installed.

-------- ThreadPool Metrics ------------------------------------------------------------------------
[--] ThreadPool stat is enabled.
[--] Thread Pool Size: 4 thread(s).
[--] Using default value is good enough for your version (10.4.32-MariaDB)

-------- MyISAM Metrics ----------------------------------------------------------------------------
[!!] Key buffer used: 18.2% (24M used / 134M cache)
[OK] Key buffer size / total MyISAM indexes: 128.0M/0B

-------- InnoDB Metrics ----------------------------------------------------------------------------
[--] InnoDB is enabled.
[--] InnoDB Thread Concurrency: 0
[OK] InnoDB File per table is activated
[!!] InnoDB buffer pool / data size: 128.0M/208.2M
[!!] Ratio InnoDB log file size / InnoDB Buffer pool size (75 %): 48.0M * 2/128.0M should be equal to 25%
[OK] InnoDB buffer pool instances: 1
[--] Number of InnoDB Buffer Pool Chunk : 1 for 1 Buffer Pool Instance(s)
[OK] Innodb_buffer_pool_size aligned with Innodb_buffer_pool_chunk_size & Innodb_buffer_pool_instances
[OK] InnoDB Read buffer efficiency: 100.00% (72592973554 hits/ 72593048291 total)
[OK] InnoDB Write log efficiency: 99.90% (462653706 hits/ 463122673 total)
[OK] InnoDB log waits: 0.00% (0 waits / 468967 writes)

-------- Aria Metrics ------------------------------------------------------------------------------
[--] Aria Storage Engine is enabled.
[OK] Aria pagecache size / total Aria indexes: 128.0M/328.0K
[!!] Aria pagecache hit rate: 94.8% (10M cached / 572K reads)

-------- TokuDB Metrics ----------------------------------------------------------------------------
[--] TokuDB is disabled.

-------- XtraDB Metrics ----------------------------------------------------------------------------
[--] XtraDB is disabled.

-------- Galera Metrics ----------------------------------------------------------------------------
[--] Galera is disabled.

-------- Replication Metrics -----------------------------------------------------------------------
[--] Galera Synchronous replication: NO
[--] No replication slave(s) for this server.
[--] Binlog format: MIXED
[--] XA support enabled: ON
[--] Semi synchronous replication Master: OFF
[--] Semi synchronous replication Slave: OFF
[--] This is a standalone server

-------- Recommendations ---------------------------------------------------------------------------
General recommendations:
    Configure your accounts with ip or subnets only, then update your configuration with skip-name-resolve=1
    We will suggest raising the 'join_buffer_size' until JOINs not using indexes are found.
             See https://dev.mysql.com/doc/internals/en/join-buffer-size.html
             (specially the conclusions at the bottom of the page).
    Performance schema should be activated for better diagnostics
    Consider installing Sys schema from https://github.com/mysql/mysql-sys for MySQL
    Consider installing Sys schema from https://github.com/FromDual/mariadb-sys for MariaDB
    Before changing innodb_log_file_size and/or innodb_log_files_in_group read this: link ommitted
Variables to adjust:
    join_buffer_size (> 256.0K, or always use indexes with JOINs)
    table_definition_cache(400) > 411 or -1 (autosizing if supported)
    performance_schema = ON enable PFS
    innodb_buffer_pool_size (>= 208.2M) if possible.
    innodb_log_file_size should be (=16M) if possible, so InnoDB total log files size equals to 25% of buffer pool size.
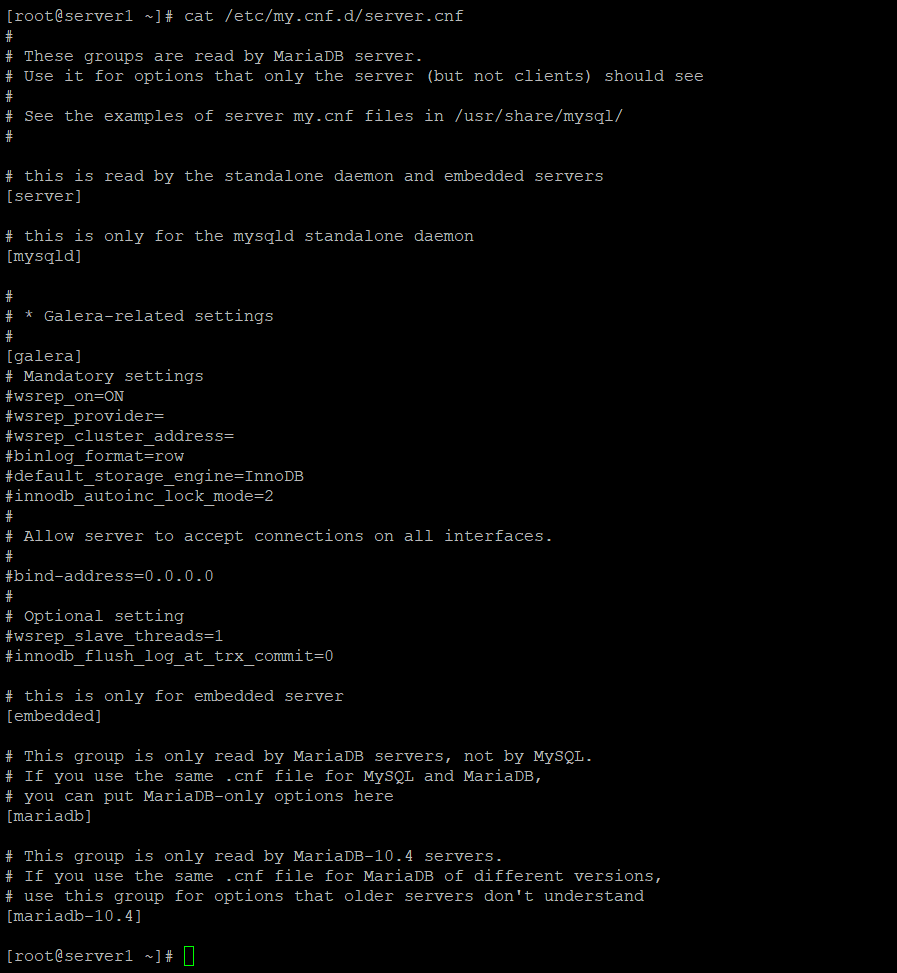
And this is the configuration file of /etc/my.cnf.d/server.cnf below.
As I mentioned earlier, I’m not really a DB guy. Can you please guide me create a correct configuration file?
2
Answers
According to this answer, You can try these approaches:
Increase Key Buffer to at least 128MB Should help immediately.
Run
mysqloptimizeandmysqlrepairon your tables Increase tablecache/ decrease total number of tables to increase the table cache
hit rate. Maybe you’ve got some unused or old tables which could be
deleted.
Other recommended confugration options:
Check log file after some time.
Overall your tunings look ok. Most reads are from buffer pool/cache. Thread and table cache are getting high number of hits. With 4 cores CPU is still under 400% corresponding to capacity.
Temporary tables 8M / 33M is high and you’ll need to look a slow query log/ indexes to work out why this is.
To do this:
long_query_time = 0.5
slow_query_log=1
log_slow_verbosity=query_plan,explain
Note: more options exist in 10.6+
These can be changed at runtime with
set global var=value, but include in configuration file for next time.Use mariadb-dumpslow on the slow query log to see what is important.