I am trying to put a dashboard together from Azure Monitor Workbooks and I am having issues with trying to use a Time Range and Time "binning".
Here’s the current query.
Note, in the query below, there is a {time} parameter (of type Time Range) that has been created as part of the Workbook steps.
requests
| where name == "Confirmation"
| where resultCode == 200
| where timestamp > {time}
| summarize c=count() by resultCode, bin(timestamp, 1h)
| render columnchart kind=stacked
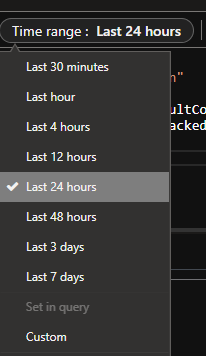
When the query is executed, it looks at the Time Range setting to filter the results ( See below image) and then groups the results in hourly blocks.
Now this is fine when your Time Range is fairly short, 24/48 hours, because the bin() is set to 1h.
However, if you extend the Time Range to 3 / 7 days, then the graph gets quite "busy" so you would want to change the bin framing to, say, 6h.
So, the question is: How can I dynamically change the binning time frame as the Time Range is changed.

 Question posted in


2
Answers
AFAIK, The only way to do it is by adding another parameter of bin like below:
Then change your query to:
then set the bin parameter like below:
So, whenever you change the time parameter, you need to change bin too. Dynamically only parameters can be changed.
Use a time range parameter:
when looking at the time range parameter editor, it shows on the bottom how that time range paramter can be formatted. one of the formatting options is
grain. See https://learn.microsoft.com/en-us/azure/azure-monitor/visualize/workbooks-time#time-parameter-optionsgrainwill produce a bin value for the time range automatically, so if the time range parameter is 30d, you get 1d, if it is 1h, you get 1m or whatever. (it tries to do sane things to produce reasonable bins). If there are too many or too few, you can always do math in the query, likebin(timestamp, {time:grain}/2)