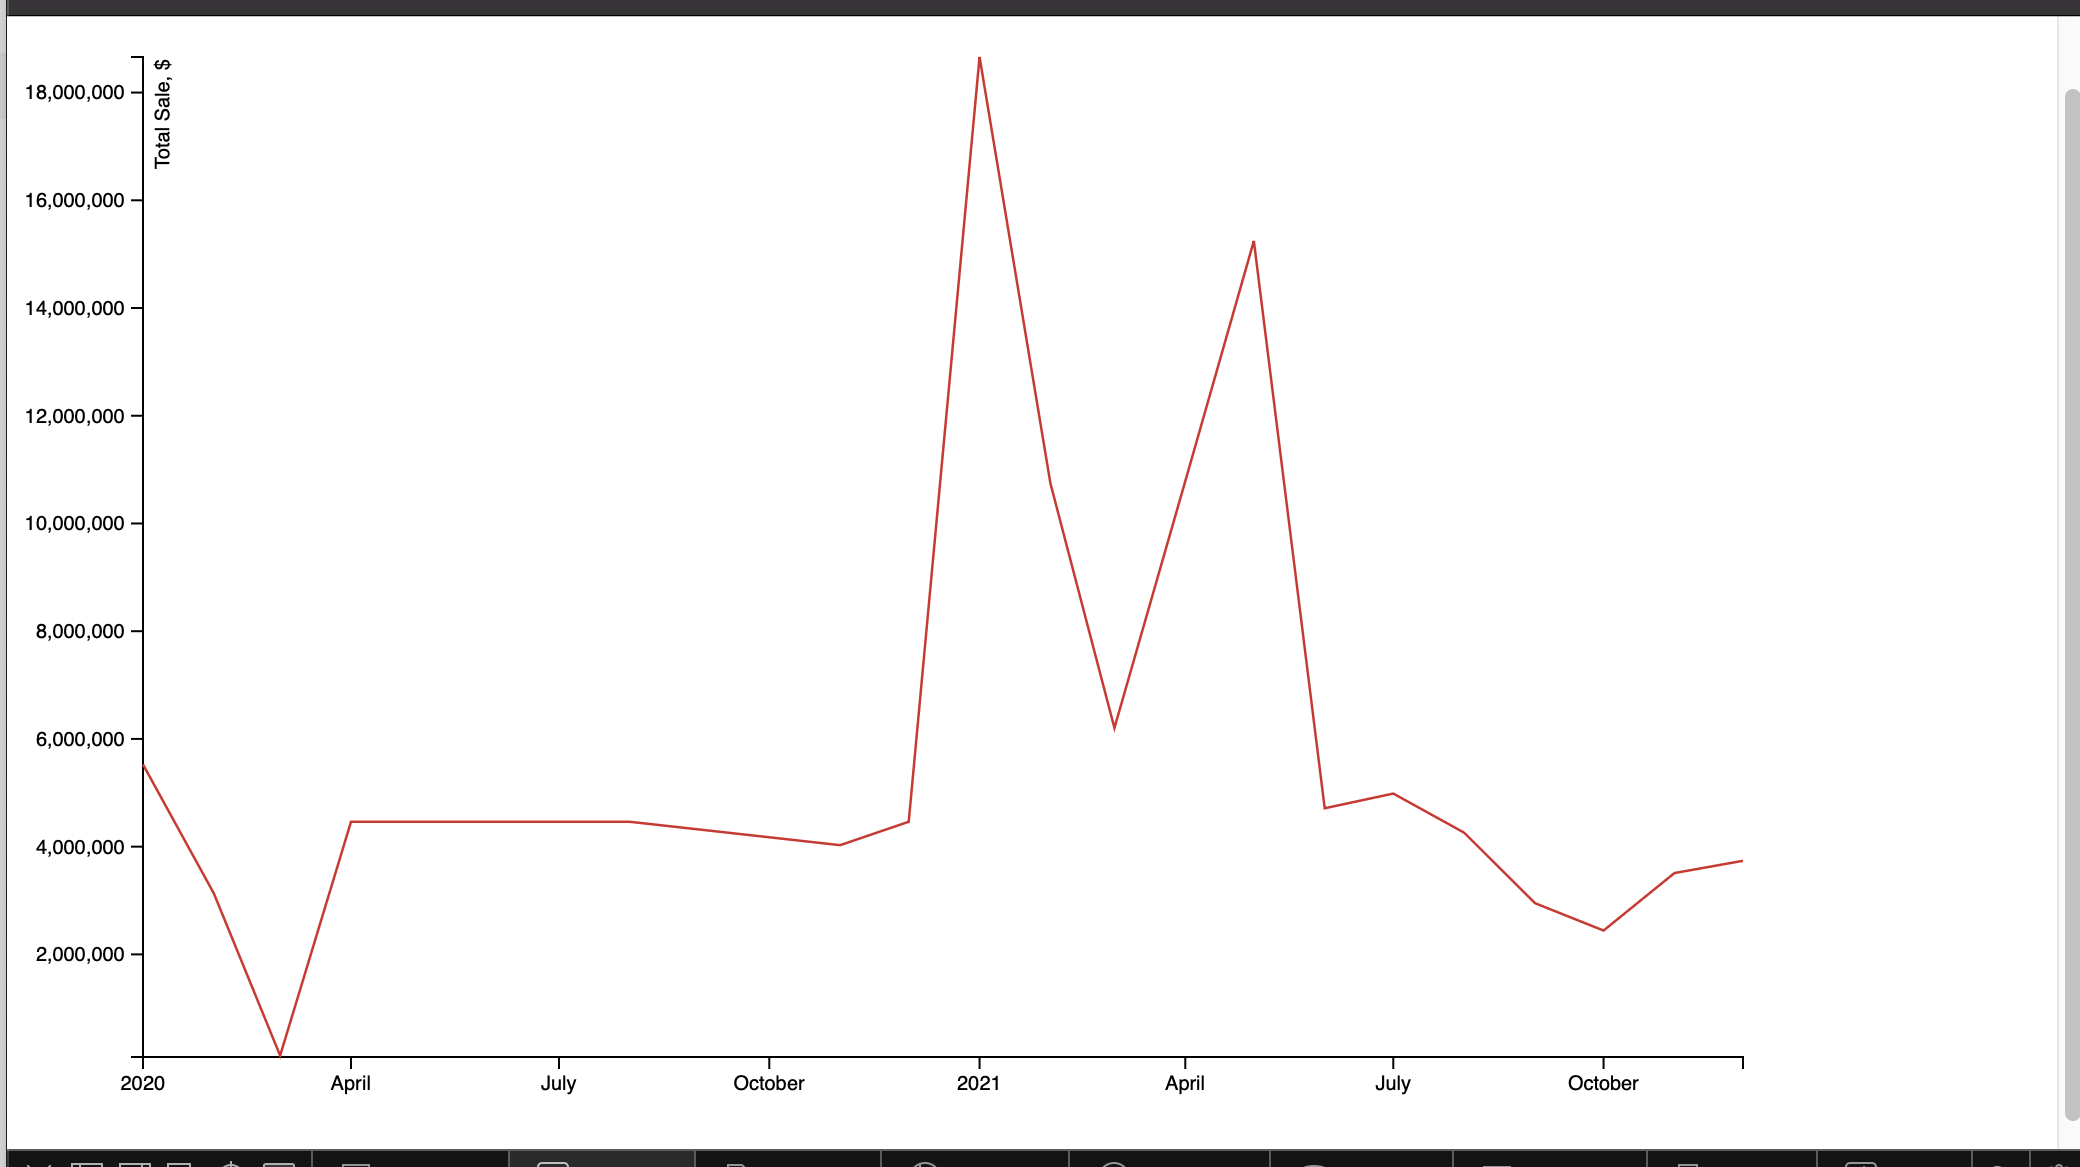
I’m creating a 3-line chart using D3v7 but only 1 is showed. I’m unable to figure out why.
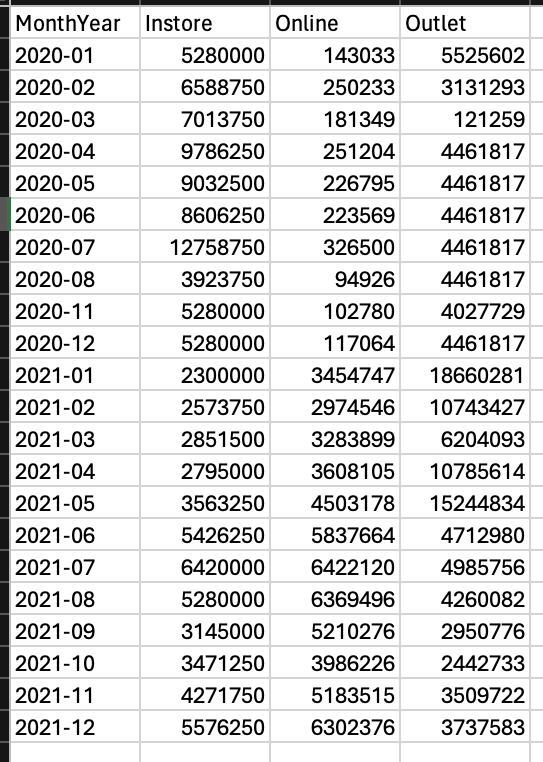
This is my dataset:
Check out my code below:
// Setup SVG
var svg = d3.select("body").append("svg")
    .attr("width", width + paddingLeft + paddingRight)
    .attr("height", height + paddingTop + paddingBottom)
    .append("g")
    .attr("transform",
          "translate(" + paddingLeft + "," + paddingTop + ")");
// Setup scales
var x = d3.scaleTime().range([0, width]);
var y = d3.scaleLinear().range([height, 0]);
var colourScale = d3.scaleOrdinal(d3.schemeCategory10);
//Line generator
var line = d3.line()
    .x(function(d) {return x(d.monthyear);
    })
    .y(function(d) { return y(d.total); });
// Load data
d3.csv('adidas_west_sales.csv').then(buildLineChart);

var parseTime = d3.timeParse("%Y-%m");

function buildLineChart(data)
{
    data.forEach(function(d)
    {
        d.MonthYear = parseTime(d.MonthYear);
    })

    var salesMethods = data.columns.slice(1).map(function(method)
    {
        return {    method: method,
                    values: data.map(function(d) {
                        return {    monthyear: d.MonthYear,
                                    total: parseFloat(d[method])
                                }
                            }
                )}
    });
    console.log(salesMethods);

    // Setup scales with data
    x.domain(d3.extent(data, function(d) {
        return d.MonthYear;}));

    y.domain([
        d3.min(salesMethods, function(b) {
            return d3.min(b.values, function(d) {
                return d.total;
            });
        }),
        d3.max(salesMethods, function(b) {
            return d3.max(b.values, function(d) {
                return d.total;
            });
        })
    ]);

    colourScale.domain(salesMethods.map(function(c) { return c.method}))
// Add Axis
svg.append("g")
    .attr("class", "axis axis--x")
    .attr("transform", "translate(0," + height + ")")
    .call(d3.axisBottom(x)
    .ticks(24)
    .tickFormat(d3.timeFormat("%b-%Y")))
    .selectAll("text")
    .style("text-anchor", "end")
    .attr("dx", "-.8em")
    .attr("dy", ".15em")
    .attr("transform", "rotate(-65)");;

svg.append("g")
    .attr("class", "axis axis--y")
    .call(d3.axisLeft(y))
    .append("text")
    .attr("transform", "rotate(-90)")
    .attr("y", 6)
    .attr("dy", "0.71em")
    .attr("fill", "#000")
    .text("Total Sale, $");

// Add lines


 const lineGraph =
    svg.selectAll("path")
          .data(salesMethods)
          .enter()
              .append("path")
              .attr('stroke', function(d, i) { return colourScale(i)})
              .attr('stroke-width', 1.25)
              .style("fill", "none")
              .attr("d", function(d) { return line(d.values); });
}
salesMethods returns 3 values: "Online", "Instore", "Outlet" but there is only 1 line showed.
Is there something missing? Any help would be greatly appreciated!

 Question posted in


2
Answers
This code snippet may resolve your problem.
Your data is essentially an array of arrays. When you get to adding your lines you need to have an outer data-bind so that d3 iterates over the outer array:
Running code here.