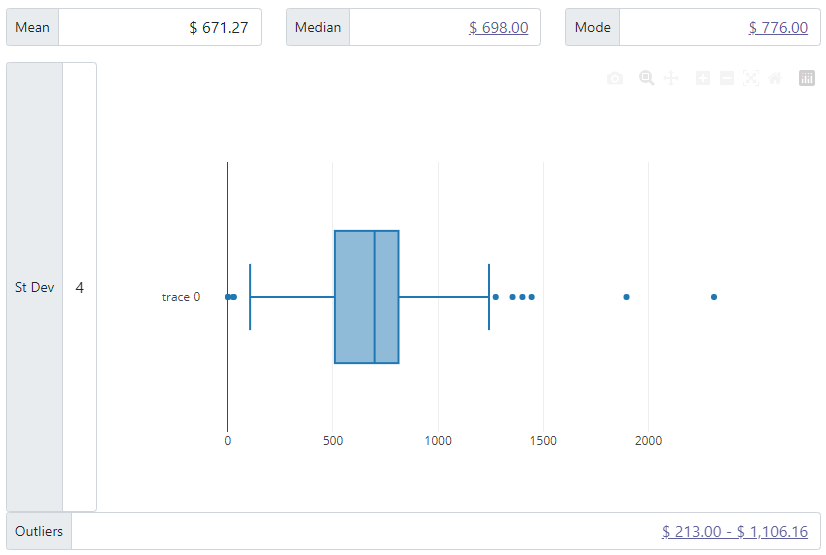
I have a blank space on my app, and I’d like to have a small box chart showing the basic distribution of a set of dollar amounts. Here’s what my page looks like, and where I’d like the chart to fit:
I’ve searched Google, and found a few options, but they’re all so complex. For instance, here’s what Plotly gave me:
See how it’s way larger than the space it’s supposed to fill? Below is more what I’m looking for:
I’m not married to Plotly, I just want a simple box chart. No interactivity or anything fancy.
Here’s my code on codepen: https://codepen.io/travisheeter/pen/Jjmayor, and the js is here for your reference:
var y0 = [525,784,674,453,241.6,532,662,465,636,508,345,29,526,476,1354.16,896.16,288.16,786,1445,870,731,521,835.16,1162.16,899.16,664.16,687.16,1896.16,1106.16,1106.16,808.16,938.16,808.16,545.16,778.16,1052.16,1274.16,125,125,125,905,822,842,706,900,369,447,361,404,514,529,913,717,806,557,1083,736,158,739,909,1108,243,584,650,427,603,603,650.16,776,933,489,789,863,779,610,1128,696,460,933,1,25,632,923,540,714,958,444,236.8,905,776,776,1000,776,584,662,770,703,817,871,793,870,776,840,695,951,905,863,589,858,533,731,589,692,410,301,170,382,243,259,420,398,364,704,612,379,279,305,213,347,368,215,295,693,770,714,618,425,484,656,896,943,683,454.16,535,524,548,732,782,725,106,596,790,656,594,496,713,883,805,718,664,836,529,677,708,884,645,1401.16,736,669,898,370,832,668,952,1066,775,1,1006,776,756,776,705,698,618,776,1242,291,905,776,754,798,713,655,811,295,840,595,613,489,851,770,740,569,474,702,414,776,743,986,767,713,665,812,827,213,716,681,675,257,665,831,223,720.16,2312.16,233,721,696]

var trace1 = {
  x: y0,
  type: 'box'
};

var data = [trace1];

Plotly.newPlot('myDiv', data);
Update: Here’s a new Pen updated to show the constraints and adding @0stone0’s answer: https://codepen.io/travisheeter/pen/MWPqEvX


2
Answers
You’ll need the
staticPlotoption to disable all fancy hover things:I’ve also added
responsiveshould you page resize.The width/height can be changed using the
widthandheightprop in thelayoutobjecthttps://plotly.com/javascript/setting-graph-size/
You can achieve this by forcing the graph div to expand/shrink according to its container (ie. so that the autosize matches the room left by the
.col-smflex item) :And in the layout, just remove the margins :
Output :