


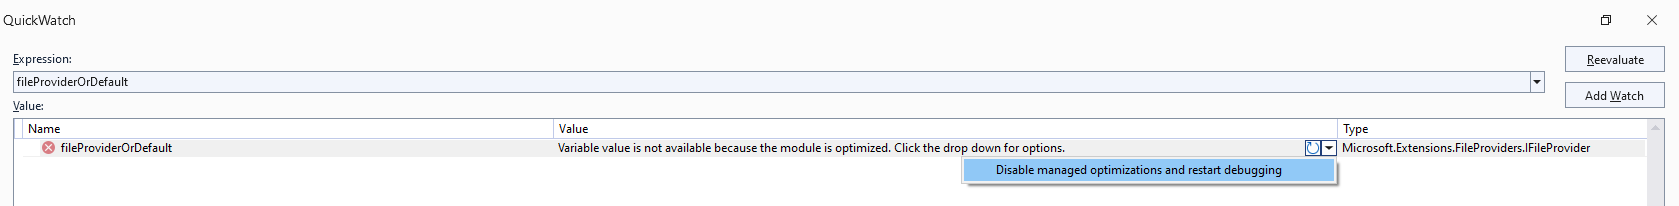
During a Visual Studio 2022 debugging session I was debugging some ASP.NET internal code using source link and the Microsoft symbol servers, and I was unable to view a variable because it had been optimized away; however, Quickview had an option for "Disable managed optimizations and restart debugging". I chose that, debugging restarted, and I was indeed able to view the variable. However I’m now worried that I’ve disabled some optimizations which may slow things down and it’s not clear to me what selecting that option actually changed. What settings does that change in Visual Studio and how can I re-enable the managed optimizations?
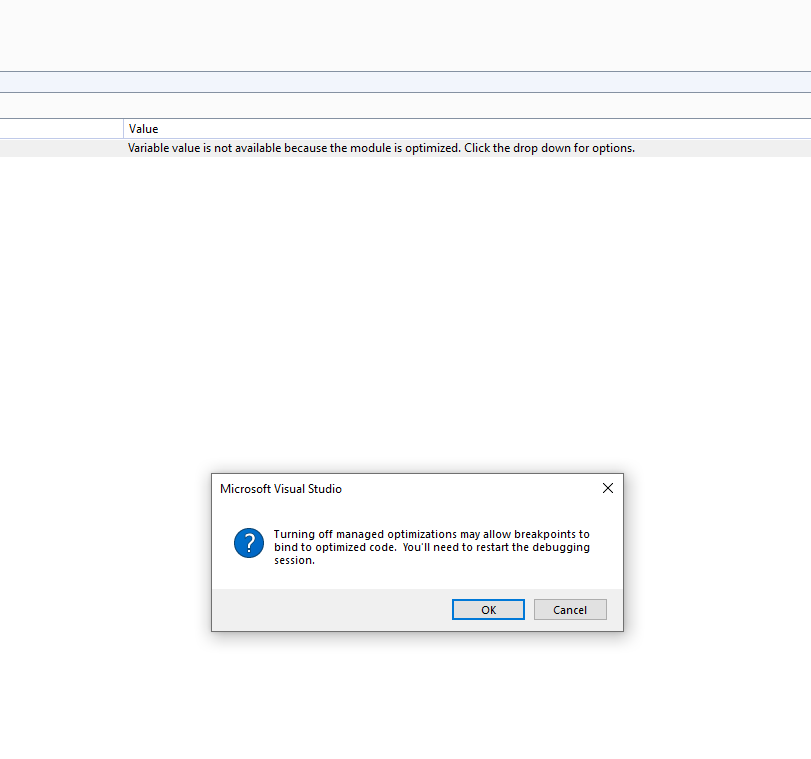
Here are some screenshots of what the option looks like in the UI dropdown, and when you click it:
2
Answers
Having optimization’s NOT TURNED on will simple "not" compile the code to run faster (as compiled machine code). Thus, you can step and see your code variables. However, in debugging large applications with a lot of code, un-epitomized code will run rather slow. So, you have a option to allow your code to run faster, but then the debugging process THEN can’t use or see the value of variables, since the debugging information for that code does not exist. If the code has been epitomized, then in most cases that means it been compiled to machine code, and the debugger really can’t then show values of variables, or even allow break-points.
In a sense, if you allow optimizations, then you are running code much like it will run as "release mode" and thus options and your ability to debug such code is much reduced.
with computers today having such VAST amounts of speed and processing, then I would accept that in near all cases, you want to debug your code with optimizations disabled.
Background-info: the different types of optimizations in .NET
In many compiled languages, like C and C++, often there’s only really just one place where optimizations are applied: when you run your compiler (though it’s also common for older toolchains, with separate compilers and linkers, to have separate compile-time and link-time optimizations).
…but in the .NET world it’s slightly more complicated:
The
cscC#-to-IL (or VB.NET-to-IL, F#, etc) compiler can optimize the IL that’s generated from your C# (the/optimizeflag).if( false ) { /* here */ }).When a built .NET assembly (.NET
.dllor.exe) is loaded by the CLR then the JIT can apply its own optimizations.DebuggableAttribute( DebuggingModes.DisableOptimizations )or withisJITOptimizerDisabled: false– this attribute is added to assemblies when usingcsc.exewith/debug.While strictly-speaking not a compiler "optimization", when a .NET program runs the CLR may load cached native-image versions of managed assemblies, which are specific to your machine.
ngen.exe– which (since Windows 8) may preemptively compile assemblies in the background without needing to runngen.exemanually.CrossGen2.readytorunand/or AOT-compiled assemblies, which have their own optimizations and is out-of-scope for this answer.Recommended Reading
[assembly: Debuggable]/DebuggableAttributeThe message-box lets you change the "Suppress JIT optimization on module load (Managed only)" setting under Tools > Options > Debugging:
Worry not: the "Suppress JIT optimization…" setting only prevents JIT optimizations for non-project assemblies when debugging – though in many cases ngen’d images will still be used (thus still running optimized cod unless you use
COMPlus_ZapDisable).Go to Debugger settings and uncheck the "Suppress JIT optimizations…" option.
You can see what’s going on if you use the Debugger Modules window to see each .NET assembly that’s loaded, along with its JIT optimization status, symbols status, and if VS considers it "user code" or not.