Hello Stack Overflow community,
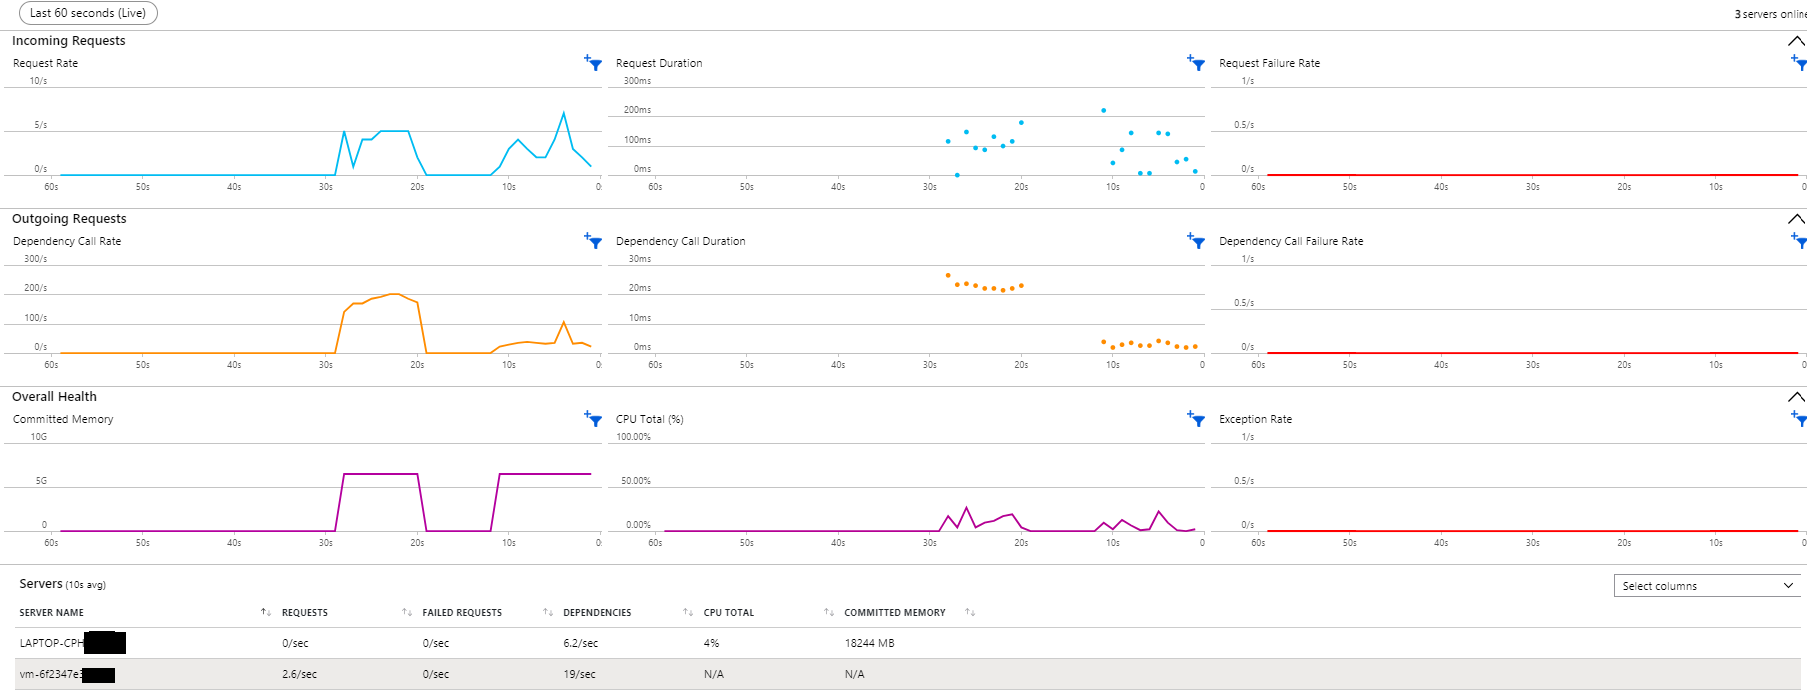
I’m facing an issue with Application Insights telemetry in my MVC 4 application when it’s deployed behind a private load balancer. Locally, the CPU and Memory telemetry is successfully pushed, but when running from a Virtual Machine behind a private load balancer, it shows "NA" as seen in the screenshot below:
Initially, I suspected the load balancer, but ongoing requests are indeed being pushed from the VM.
Here’s how I’ve configured Application Insights in my Startup.cs:
[assembly: OwinStartup(typeof(DesignHub.WebMvc.Startup))]
public class Startup
{
    public void Configuration(IAppBuilder app)
    {
        string appInsightsConnectionString = ConfigurationManager.AppSettings["AppInsightsConnectionString"];

        Configure Application Insights
        if (string.IsNullOrEmpty(appInsightsConnectionString) == false)
        {
            TelemetryConfiguration.Active.ConnectionString = appInsightsConnectionString;
        }
    }
}
I’d greatly appreciate any insights or suggestions on what might be causing this discrepancy and how to resolve it.
Thank you for your assistance!


2
Answers
The core issue lies in the IIS Application Pool's identity lacking sufficient permissions to access performance counters, impeding proper monitoring and resource analysis.
Resolution Steps:
Verify Application Pool Identity:
Grant Permissions:
Open an elevated Command Prompt window (Run as administrator).
Execute the following command, replacing PoolName with the actual name of your Application Pool:
Validate the Fix:
Restart the Application Pool (right-click on the pool in IIS Manager and select "Restart").
Attempt to access or collect performance counters after the restart. Confirm that the issue is resolved.
Looks like you need to give permissions to read computer-level performance counter values.
I suggest you give the following troubleshoot guide a try:
https://learn.microsoft.com/en-us/troubleshoot/azure/azure-monitor/app-insights/missing-cpu-total-committed-memory-metrics