


can someone help me show my query graph in chronological order? Here’s what I have now:
- A query listing out any user stories that have the tag ‘unplanned’ in a bunch of area paths.
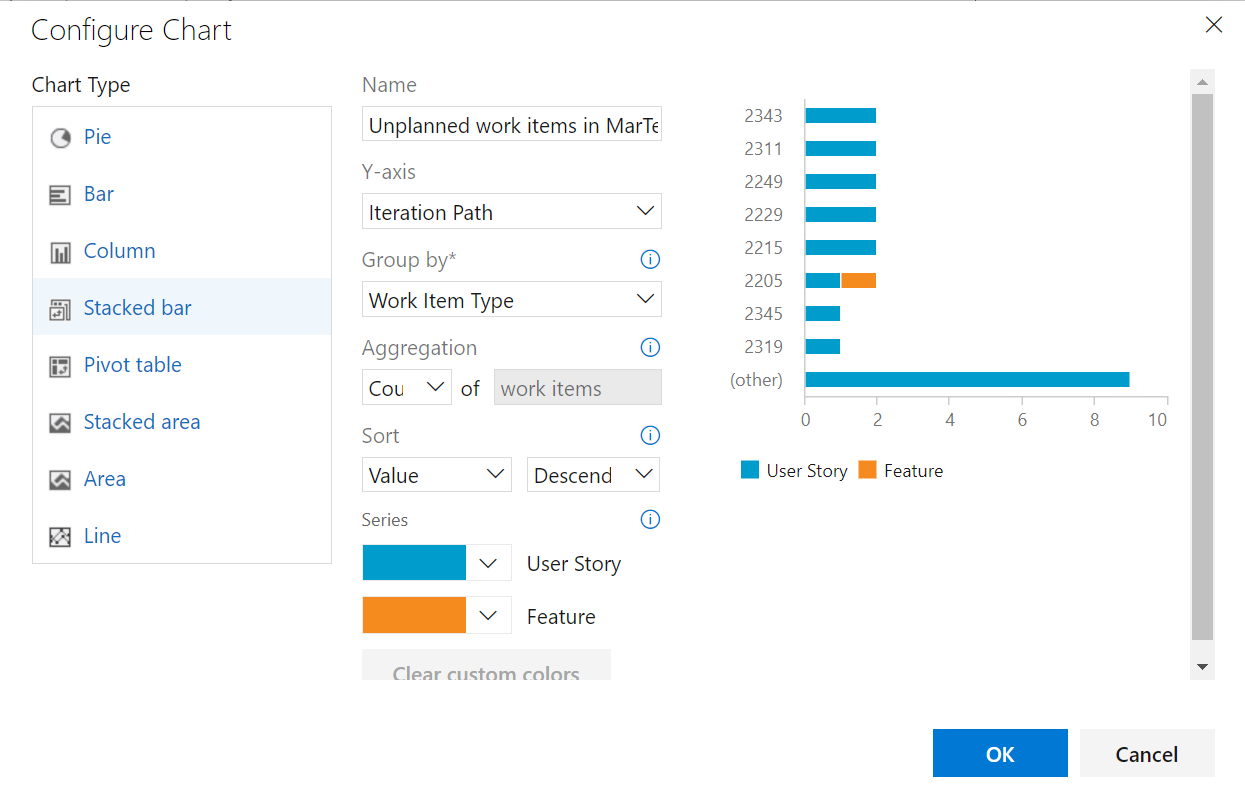
- A chart: Chart configurations
I’d like to showcase on the Y axis the iterations in chronological order, not the amount of most unplanned items. FYI, the aggregation can only be ‘Count’.
I have tried to change the query to only show results for the current iteration path, but this gave an error in the query. Also, it’s a less useful view.
I have tried different formats and played around with the available graphs.
Thanks!
2
Answers
Unfortunately, Azure DevOps charts have quite limited functionality. I would suggest to review 3rd party tools like PowerBI that can give ability to do custom order of your data.
If the order of the strings of your "iteration path" is consistent with the order of the date range corresponding to the iteration, you may consider using the widget "Chart for Work Items".
Create a query with the following defination.

Add a widget Chart for Work Items to the dashboard.

If the order of your "iteration path" string is inconsistent with the order of its corresponding dates, it’s suggested that you could submit a feature request on:
https://developercommunity.visualstudio.com/report?space=21&entry=suggestion, since there is no such a default chart that can meet your needs.