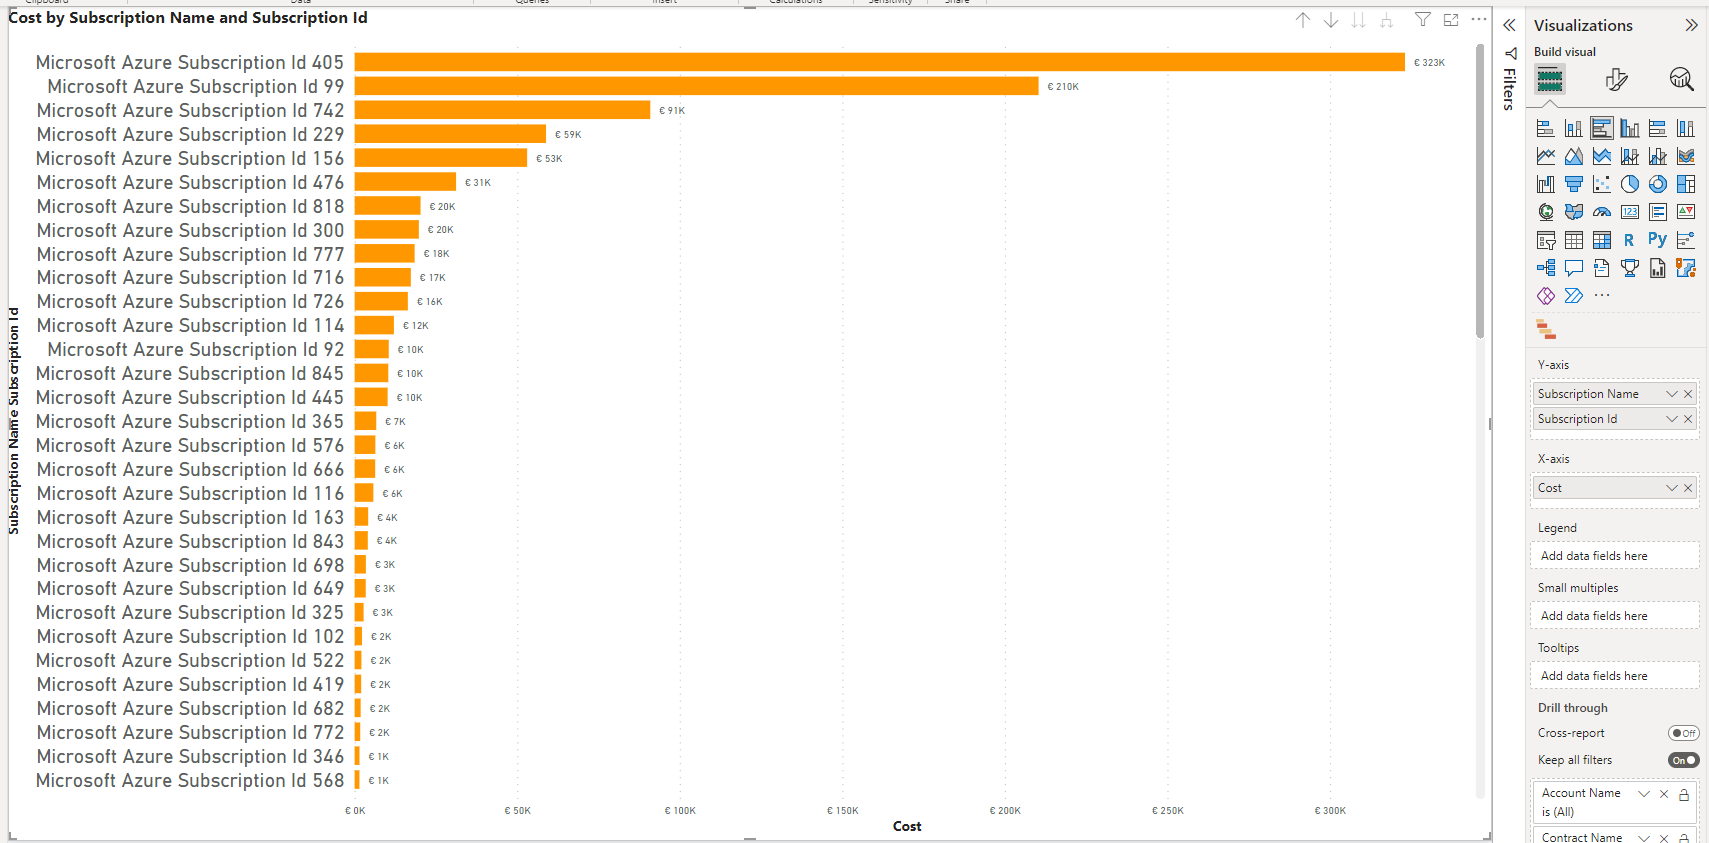
I’ve this Power BI graph with Subscription Name and Subscription Id by Cost:
and I would like to see the subscription name but group by id, so I want to display only the Subscrption Name by Cost but with Subscription Id granularity.
If I remove the subscription ID, it always groups by Subscription Name, where there is only one single bar for Microsoft Azure.
I tried to use this DAX measure:
Field Color =
IF (FIRSTNONBLANKVALUE('Dim Azure Resource'[Subscription Id], 1), "#FFFFFF", "#000000")
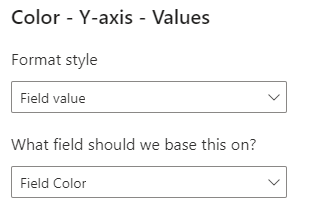
and use it in conditional formatting to change the colour, but without success:
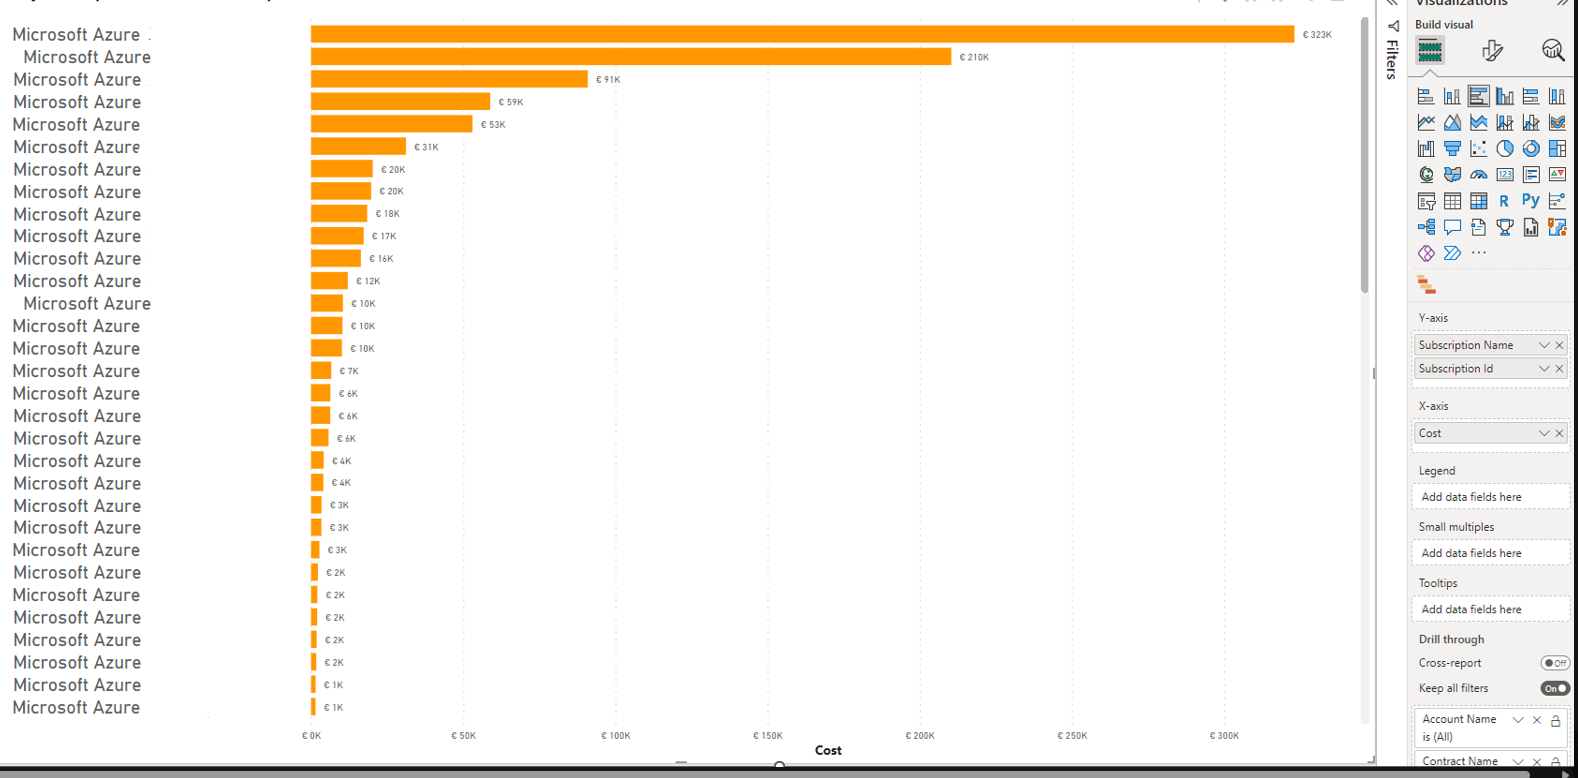
The graph output desire will be:
Sample data:
Subscription Name Subscrption Id     Cost
Microsoft Azure   Subscription Id 1  1412
Microsoft Azure   Subscription Id 2  34
Microsoft Azure   Subscription Id 3  214
Microsoft Azure   Subscription Id 4  231
Microsoft Azure   Subscription Id 5  645
Can anyone please help me in achieving this?
Thank you!


2
Answers
With this alternative solution it was possible to solve the problem: https://community.powerbi.com/t5/Desktop/Show-the-sum-of-the-value-group-by-subscription-ID-but-in-graph/td-p/3209368#M1082317
Logically it is not feasible till April-2023 update in Power BI.If you used "FirstNonBlankValue" or Left Function it evaluate the expression on all Y Axis and change the color of whole lineitem.You can post this suggest to https://ideas.powerbi.com/
for futur availibility.
Thanks