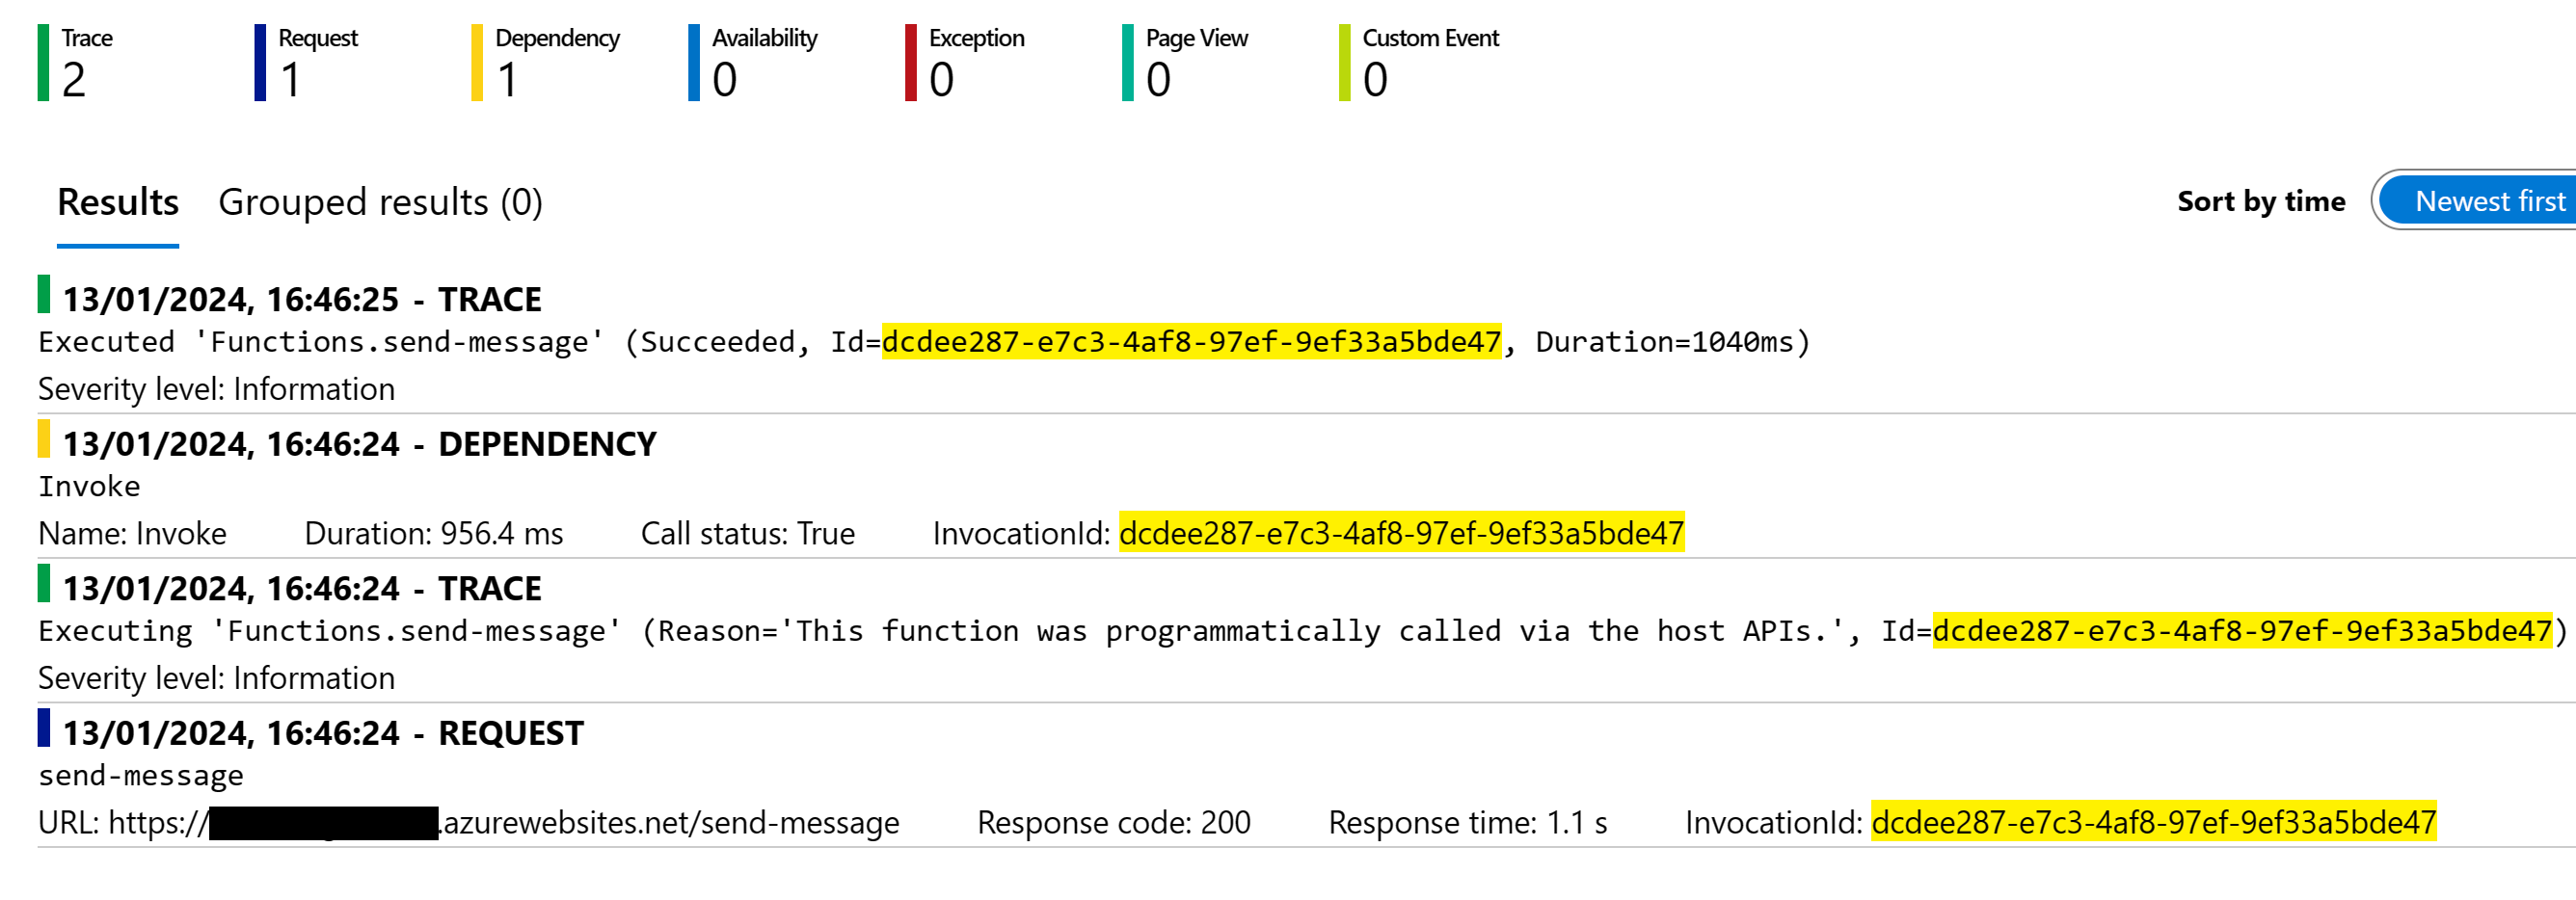
Why is it that when I inject ILogger<MyClassName> and call Logger.LogInformation I don’t see that in Application Insights, but when I call Logger.LogError I do?
Here is my code
    public async ValueTask DeleteMessageAsync(string chatId, int messageId)
    {
        Logger.LogInformation(
            "Deleting message: {chatId} {messageId}",
            chatId,
            messageId);

        try
        {
            await TelegramBotClient.DeleteMessageAsync(chatId, messageId);
        }
        catch (ApiRequestException ex)
            when (ex.ErrorCode == (int)HttpStatusCode.BadRequest)
        {
            Logger.LogError(ex, "Could not Delete message");
        }
    }
Here is an example of the event showing up in the Live Metrics section of Application Insights.
Here is the result of searching for that InvokationId
I also get zero results when searching for the word "Piff", which is clearly in the live view.
Here is the logging section of my host.json file
  "logging": {
    "applicationInsights": {
      "samplingSettings": {
        "isEnabled": true,
        "excludedTypes": "Request"
      },
      "enableLiveMetricsFilters": true
    },
    "DurableTask.AzureStorage": "Information",
    "DurableTask.Core": "Information",
    "logLevel": {
      "Default": "Information",
      "Microsoft": "Information",
      "Microsoft.Hosting.Lifetime": "Information"
    }
}
Here is the host builder for my Azure functions app
IHost host = new HostBuilder()
    .AddServiceDefaults(useOtlpExporter: false, isDevelopment: true)
    .ConfigureFunctionsWorkerDefaults()
    .ConfigureServices(services =>
    {
        services.AddApplicationInsightsTelemetryWorkerService();
        services.ConfigureFunctionsApplicationInsights();
        services.AddSingleton<ITelegramBroadcastService, TelegramBroadcastService>();
        services.AddSingleton<IAuthorizationService, AuthorizationService>();
        services.AddDurableTaskClient(x =>
        {
        });
        services.AddAzureClients(clientBuilder =>
        {
            clientBuilder.AddBlobServiceClient(Environment.GetEnvironmentVariable("AzureWebJobsStorage"));
        });
    })
    .ConfigureAppConfiguration((context, config) =>
    {
        if (context.HostingEnvironment.IsDevelopment())
            config.AddUserSecrets<Program>();
    })
    .Build();

host.Run();
The AddServiceDefaults extension is the one added by default in a new Aspire app.
using Microsoft.AspNetCore.Builder;
using Microsoft.AspNetCore.Diagnostics.HealthChecks;
using Microsoft.Extensions.DependencyInjection;
using Microsoft.Extensions.Diagnostics.HealthChecks;
using Microsoft.Extensions.Logging;
using OpenTelemetry.Logs;
using OpenTelemetry.Metrics;
using OpenTelemetry.Trace;

namespace Microsoft.Extensions.Hosting;

public static class Extensions
{
    public static T AddServiceDefaults<T>(this T builder, bool useOtlpExporter, bool isDevelopment)
        where T : IHostBuilder
    {
        builder.ConfigureOpenTelemetry(
            useOtlpExporter: useOtlpExporter,
            isDevelopment: isDevelopment);
        builder.AddDefaultHealthChecks();
        builder.AddServiceDiscovery();
        return builder;
    }

    public static T AddServiceDiscovery<T>(this T builder)
        where T : IHostBuilder
    {
        builder.ConfigureServices(services =>
        {
            services.AddServiceDiscovery();
        });
        return builder;
    }

    public static T ConfigureHttpClientDefaults<T>(this T builder)
        where T : IHostBuilder
    {
        builder.ConfigureServices(services =>
        {
            services.ConfigureHttpClientDefaults(http =>
            {
                // Turn on resilience by default
                http.AddStandardResilienceHandler();

                // Turn on service discovery by default
                http.UseServiceDiscovery();
            });
        });
        return builder;
    }

    public static T ConfigureOpenTelemetry<T>(this T builder, bool useOtlpExporter, bool isDevelopment)
        where T : IHostBuilder
    {
        builder.ConfigureLogging(logging =>
        {
            logging.AddOpenTelemetry(telemetry =>
            {
                telemetry.IncludeFormattedMessage = true;
                telemetry.IncludeScopes = true;
            });
        });

        builder.ConfigureServices(services =>
        {
            services.AddOpenTelemetry()
                .WithMetrics(metrics =>
                {
                    metrics.AddRuntimeInstrumentation()
                           .AddBuiltInMeters();
                })
                .WithTracing(tracing =>
                {
                    if (isDevelopment)
                    {
                        // We want to view all traces in development
                        tracing.SetSampler(new AlwaysOnSampler());
                    }

                    tracing.AddAspNetCoreInstrumentation()
                           .AddGrpcClientInstrumentation()
                           .AddHttpClientInstrumentation();
                });
        });

        builder.AddOpenTelemetryExporters(useOtlpExporter);

        return builder;
    }

    private static T AddOpenTelemetryExporters<T>(this T builder, bool useOtlpExporter)
        where T : IHostBuilder
    {
        builder.ConfigureServices(services =>
        {
            if (useOtlpExporter)
            {
                services.Configure<OpenTelemetryLoggerOptions>(logging => logging.AddOtlpExporter());
                services.ConfigureOpenTelemetryMeterProvider(metrics => metrics.AddOtlpExporter());
                services.ConfigureOpenTelemetryTracerProvider(tracing => tracing.AddOtlpExporter());
            }

            // Uncomment the following lines to enable the Prometheus exporter (requires the OpenTelemetry.Exporter.Prometheus.AspNetCore package)
            //services
            //    .AddOpenTelemetry();
            //    .WithMetrics(metrics => metrics.AddPrometheusExporter());

            // Uncomment the following lines to enable the Azure Monitor exporter (requires the Azure.Monitor.OpenTelemetry.Exporter package)
            //services
            //    .AddOpenTelemetry()
            //    .UseAzureMonitor();
        });

        return builder;
    }

    public static T AddDefaultHealthChecks<T>(this T builder)
        where T : IHostBuilder
    {
        builder.ConfigureServices(services =>
        {
            services.AddHealthChecks()
                // Add a default liveness check to ensure app is responsive
                .AddCheck("self", () => HealthCheckResult.Healthy(), ["live"]);
        });
        return builder;
    }

    public static WebApplication MapDefaultHealthCheckEndpoints(this WebApplication app)
    {
        // Uncomment the following line to enable the Prometheus endpoint (requires the OpenTelemetry.Exporter.Prometheus.AspNetCore package)
        // app.MapPrometheusScrapingEndpoint();

        // All health checks must pass for app to be considered ready to accept traffic after starting
        app.MapHealthChecks("/health");

        // Only health checks tagged with the "live" tag must pass for app to be considered alive
        app.MapHealthChecks("/alive", new HealthCheckOptions
        {
            Predicate = r => r.Tags.Contains("live")
        });

        return app;
    }

    private static MeterProviderBuilder AddBuiltInMeters(this MeterProviderBuilder meterProviderBuilder) =>
        meterProviderBuilder.AddMeter(
            "Microsoft.AspNetCore.Hosting",
            "Microsoft.AspNetCore.Server.Kestrel",
            "System.Net.Http");
}
Here are the app settings that are applied according to portal.azure.com
{
    "deployment_branch": "master",
    "SCM_TRACE_LEVEL": "Verbose",
    "SCM_COMMAND_IDLE_TIMEOUT": "60",
    "SCM_LOGSTREAM_TIMEOUT": "7200",
    "SCM_BUILD_ARGS": "",
    "AzureWebJobsStorage": "DefaultEndpointsProtocol=https;AccountName=...AccountKey=...=;EndpointSuffix=core.windows.net",
    "AzureWebJobsSecretStorageType": "Blob",
    "WEBSITE_USE_PLACEHOLDER_DOTNETISOLATED": "1",
    "APPLICATIONINSIGHTS_CONNECTION_STRING": "InstrumentationKey=...IngestionEndpoint=https://eastus-8.in.applicationinsights.azure.com/;LiveEndpoint=https://eastus.livediagnostics.monitor.azure.com/",
    "WEBSITE_SLOT_NAME": "Production",
    "SCM_USE_LIBGIT2SHARP_REPOSITORY": "0",
    "WEBSITE_SITE_NAME": "...",
    "FUNCTIONS_EXTENSION_VERSION": "~4",
    "WEBSITE_AUTH_ENABLED": "False",
    "ScmType": "None",
    "WEBSITE_RUN_FROM_PACKAGE": "1",
    "FUNCTIONS_WORKER_RUNTIME": "dotnet-isolated"
}


2
Answers
In your
appsettings.json:If you have multiple
appsettings.jsonbased on your environment, be sure to select your environment properly and edit that specificappsettings.json.For example, if you are in
developmentenvironment, make sure to set these settings inappsettings.Development.json.The
AddApplicationInsightsTelemetryWorkerService()adds a default logging rule that only allows Warning or higher to go to Application Insights.Check the documentation here at https://learn.microsoft.com/en-us/azure/azure-functions/dotnet-isolated-process-guide?tabs=windows#start-up-and-configuration
It has a specific part that removes this default rule. Why it was implemented in the first place I don’t know, but it confused me at first as well why it wasn’t showing all my logs.