I’m trying to enable Azure Monitor for VMs using Terraform. The current code for enabling Azure Monitor for VMs is as follows:
# Deploy the Azure data collection endpoint for monitoring Windows VM.
resource "azurerm_monitor_data_collection_endpoint" "vminsights" {
  name                = local.dce_azure_monitor_name
  location            = data.azurerm_resource_group.ws.location
  resource_group_name = data.azurerm_resource_group.ws.name
  kind                = "Windows"
  description         = "Data collection endpoint for Windows"
}

resource "azurerm_monitor_data_collection_rule" "vminsights" {
  name                        = local.data_collection_rule_name
  resource_group_name         = data.azurerm_resource_group.ws.name
  location                    = data.azurerm_resource_group.ws.location
  tags                        = local.tre_user_resources_tags
  data_collection_endpoint_id = azurerm_monitor_data_collection_endpoint.vminsights.id

  data_flow {
    destinations = [ "log-analytics" ]
    streams      = [ "Microsoft-Event" ]
  }

  data_flow {
    destinations = [ "log-analytics" ]
    streams      = [ "Microsoft-InsightsMetrics" ]
  }

  data_flow {
    destinations = [ "log-analytics" ]
    streams      = [ "Microsoft-ServiceMap" ]
  }

  data_sources {
    extension {
      extension_name     = "DependencyAgent"
      name               = "DependencyAgentDataSource"
      streams            = [ "Microsoft-ServiceMap" ]
    }

    performance_counter {
      counter_specifiers            = [ "\VmInsights\DetailedMetrics" ]
      name                          = "insights-metrics"
      sampling_frequency_in_seconds = 60
      streams                       = [
        "Microsoft-Perf",
        "Microsoft-InsightsMetrics"
      ]
    }

    windows_event_log {
      name           = "windows-events"
      streams        = [ "Microsoft-Event" ]
      x_path_queries = [
        "Application!*[System[(Level=1 or Level=2 or Level=3)]]",
        "System!*[System[(Level=1 or Level=2 or Level=3)]]"
      ]
    }
  }

  destinations {
    log_analytics {
      name                  = "log-analytics"
      workspace_resource_id = data.azurerm_log_analytics_workspace.ws.id
    }
  }
}

# Associate to a Data Collection Rule
resource "azurerm_monitor_data_collection_rule_association" "vminsights" {
  name                    = local.data_collection_rule_name_assoc
  data_collection_rule_id = azurerm_monitor_data_collection_rule.vminsights.id
  description             = "Monitor data collection rule for VM ${azurerm_windows_virtual_machine.windowsvm.name}"
  target_resource_id      = azurerm_windows_virtual_machine.windowsvm.id
}

# Associate to a Data Collection Endpoint
resource "azurerm_monitor_data_collection_rule_association" "vm_endpoint" {
  target_resource_id          = azurerm_windows_virtual_machine.windowsvm.id
  data_collection_endpoint_id = azurerm_monitor_data_collection_endpoint.vminsights.id
  description                 = "Monitor data collection rule for VM ${azurerm_windows_virtual_machine.windowsvm.name}"
}
In another TF file (for creating the VM) I have the following:
resource "azurerm_virtual_machine_extension" "windowsvm_azure_monitor" {
  depends_on = [
    azurerm_monitor_data_collection_rule_association.vminsights
  ]
  name                       = "AzureMonitorWindowsAgent"
  virtual_machine_id         = azurerm_windows_virtual_machine.windowsvm.id
  publisher                  = "Microsoft.Azure.Monitor"
  type                       = "AzureMonitorWindowsAgent"
  type_handler_version       = "1.14"
  auto_upgrade_minor_version = true
  automatic_upgrade_enabled  = true
  settings                   = <<SETTINGS
  {
    "authentication": {
      "managedIdentity": {
        "identifier-name": "mi_res_id",
          "identifier-value": "${azurerm_windows_virtual_machine.windowsvm.identity[0].principal_id}"
      }
    }
  }
  SETTINGS
}

resource "azurerm_virtual_machine_extension" "windowsvm_dependency_agent" {
  depends_on = [
    azurerm_monitor_data_collection_rule_association.vminsights,
    azurerm_monitor_data_collection_rule_association.vm_endpoint
  ]
  name                       = "DependencyAgentWindows"
  auto_upgrade_minor_version = true
  automatic_upgrade_enabled  = true
  publisher                  = "Microsoft.Azure.Monitoring.DependencyAgent"
  type                       = "DependencyAgentWindows"
  type_handler_version       = "9.10"
  virtual_machine_id         = azurerm_windows_virtual_machine.windowsvm.id
  settings                   = jsonencode({ "enableAMA" = "true" })
}
I can certify that any other required resources (for instance, a Log Analytics resource, User assigned identities, etc.) are created. When the deployment is finished, all the created resources seem to be connected as expected. For instance, a Data Collection Rule is created and associated with the VM and with a Data Collection Endpoint, and the VM has AzureMonitorWindowsAgent and DependencyAgent extensions installed.
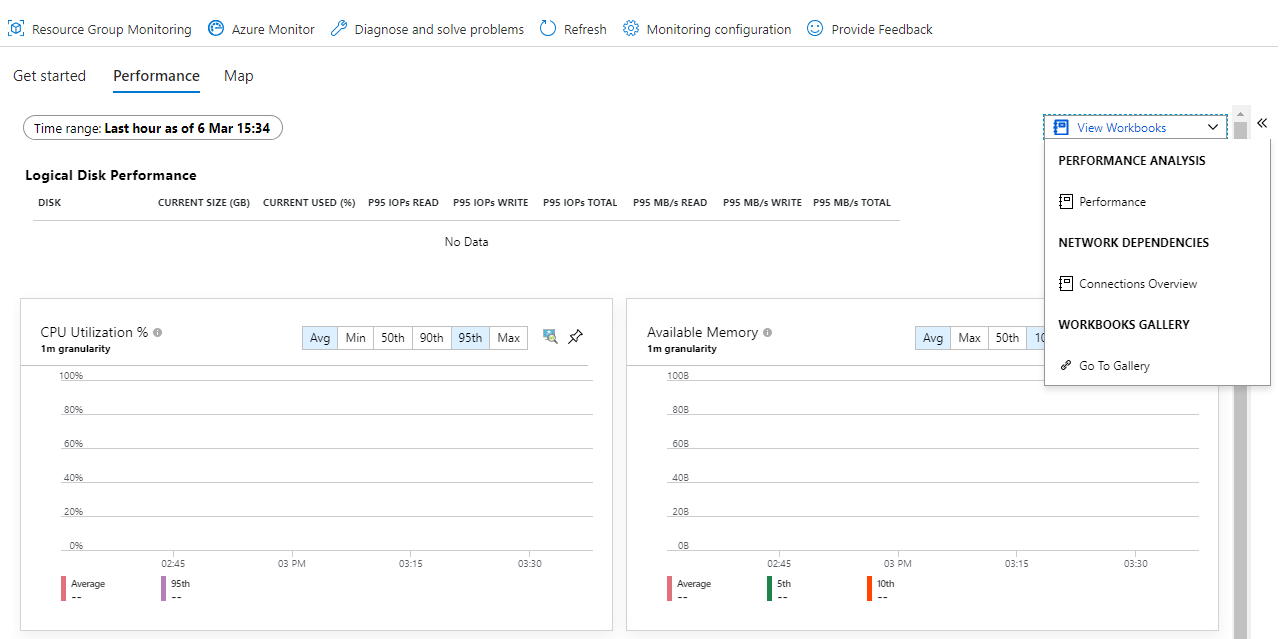
When deploying a new VM, I can visit the blade Monitoring > Insights (belonging to the newly deployed VM), and I’m presented with tabs Get started, Performance and Map. It’s coherent with the expected result, and makes me think that the VM was correctly onboarded on Azure Monitor for VMs. However, when I click on Map, only the message Select a machine or group to view a map… shows up, and when I click on Performance, I see only empty charts.
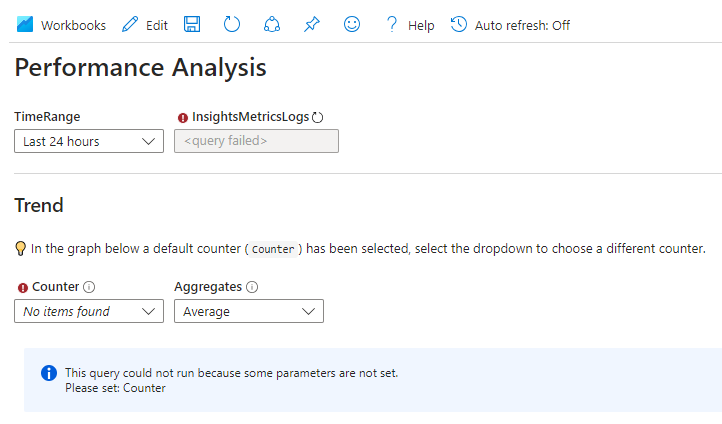
On the other hand, on both Performance and Map tabs, there’s a View Workbooks dropdown list. Whenever I select any of the options available, I’m led to a page showing some kind of error or negative message. For instance, after selecting Performance Analysis > Performance workbook, I see what is shown on the screenshot below.
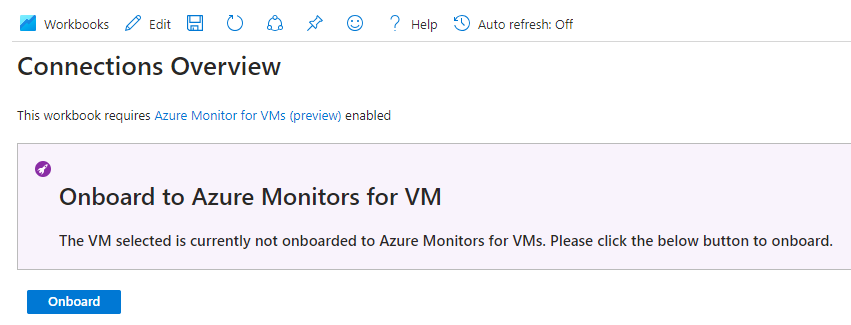
And if I select "Network Dependencies > Connections Overview" workbook, I see the message below, saying that the VM is not onboarded yet on Azure Monitor for VMs (as shown below).
According to the 1 the following endpoints must be accessible from the VM, through HTTPS:
global.handler.control.monitor.azure.com<virtual-machine-region-name>.handler.control.monitor.azure.com<log-analytics-workspace-id>.ods.opinsights.azure.com
I tested all of them, and succeeded connecting to them. There’s also the following note on 1: The Dependency agent requires a connection from the virtual machine to the address 169.254.169.254. This address identifies the Azure metadata service endpoint. Ensure that firewall settings allow connections to this endpoint. Regarding to this, I have allowed connections to IP address 169.254.169.254, to any open ports.
As a final note, I have waited 60+ minutes after deploying everything, in order to be sure that any problems were due to very recent deployments.
1 https://learn.microsoft.com/en-us/azure/azure-monitor/vm/vminsights-enable-overview#agents


2
Answers
Finally I could get it working. I separated everything in 2 Terraform files. Here is the final code:
vm_insights.tf(this one is almost identical than the original version posted in the question, but you can see that now aSystemAssignedidentity is being used):windowsvm.tf(this one had important changes, as you can see, the resourceazurerm_virtual_machine_extension.windowsvm_azure_monitordoes not require the optionsettingsfor defining the Azure Monitor Windows Agent's identity; the Agent will login to the Log Analytics workspace using theSystemAssignedidentity defined in the filevm_insights.tf):global.handler.control.monitor.azure.com<virtual-machine-region-name>.handler.control.monitor.azure.com<log-analytics-workspace-id>.ods.opinsights.azure.comIt's worthy verifying if the VM can really access these endpoints. In my tests it happens out of the box, no need to change firewall rules. However, there's another endpoint that must be accessible from the VM, and which is not mentioned in the [1]. It is:
<DATA_COLLECTION_ENDPOINT_NAME>.<AZURE_REGUION>-1.handler.control.monitor.azure.comThus, once the changes shown in this answer were applied, I got the metrics!
[1] https://learn.microsoft.com/en-us/azure/azure-monitor/vm/vminsights-enable-overview#agents
Your code looks good to me, and it is a very transient issue that you are facing. Fetching Virtual machine details takes long in some cases so waiting for some time after deployment to fetch the chart relevant details will be one solution for this kind of issue. And also check that the workspace you have selected is properly configured for real time monitoring data.
I’ve made few changes to you code as given below and was able to deploy it successfully. Once it is deployed, I was able to view the chart for virtual machine utilization and also workbooks related details without any conflicts.
Deployment succeeded: