skip to Main Content

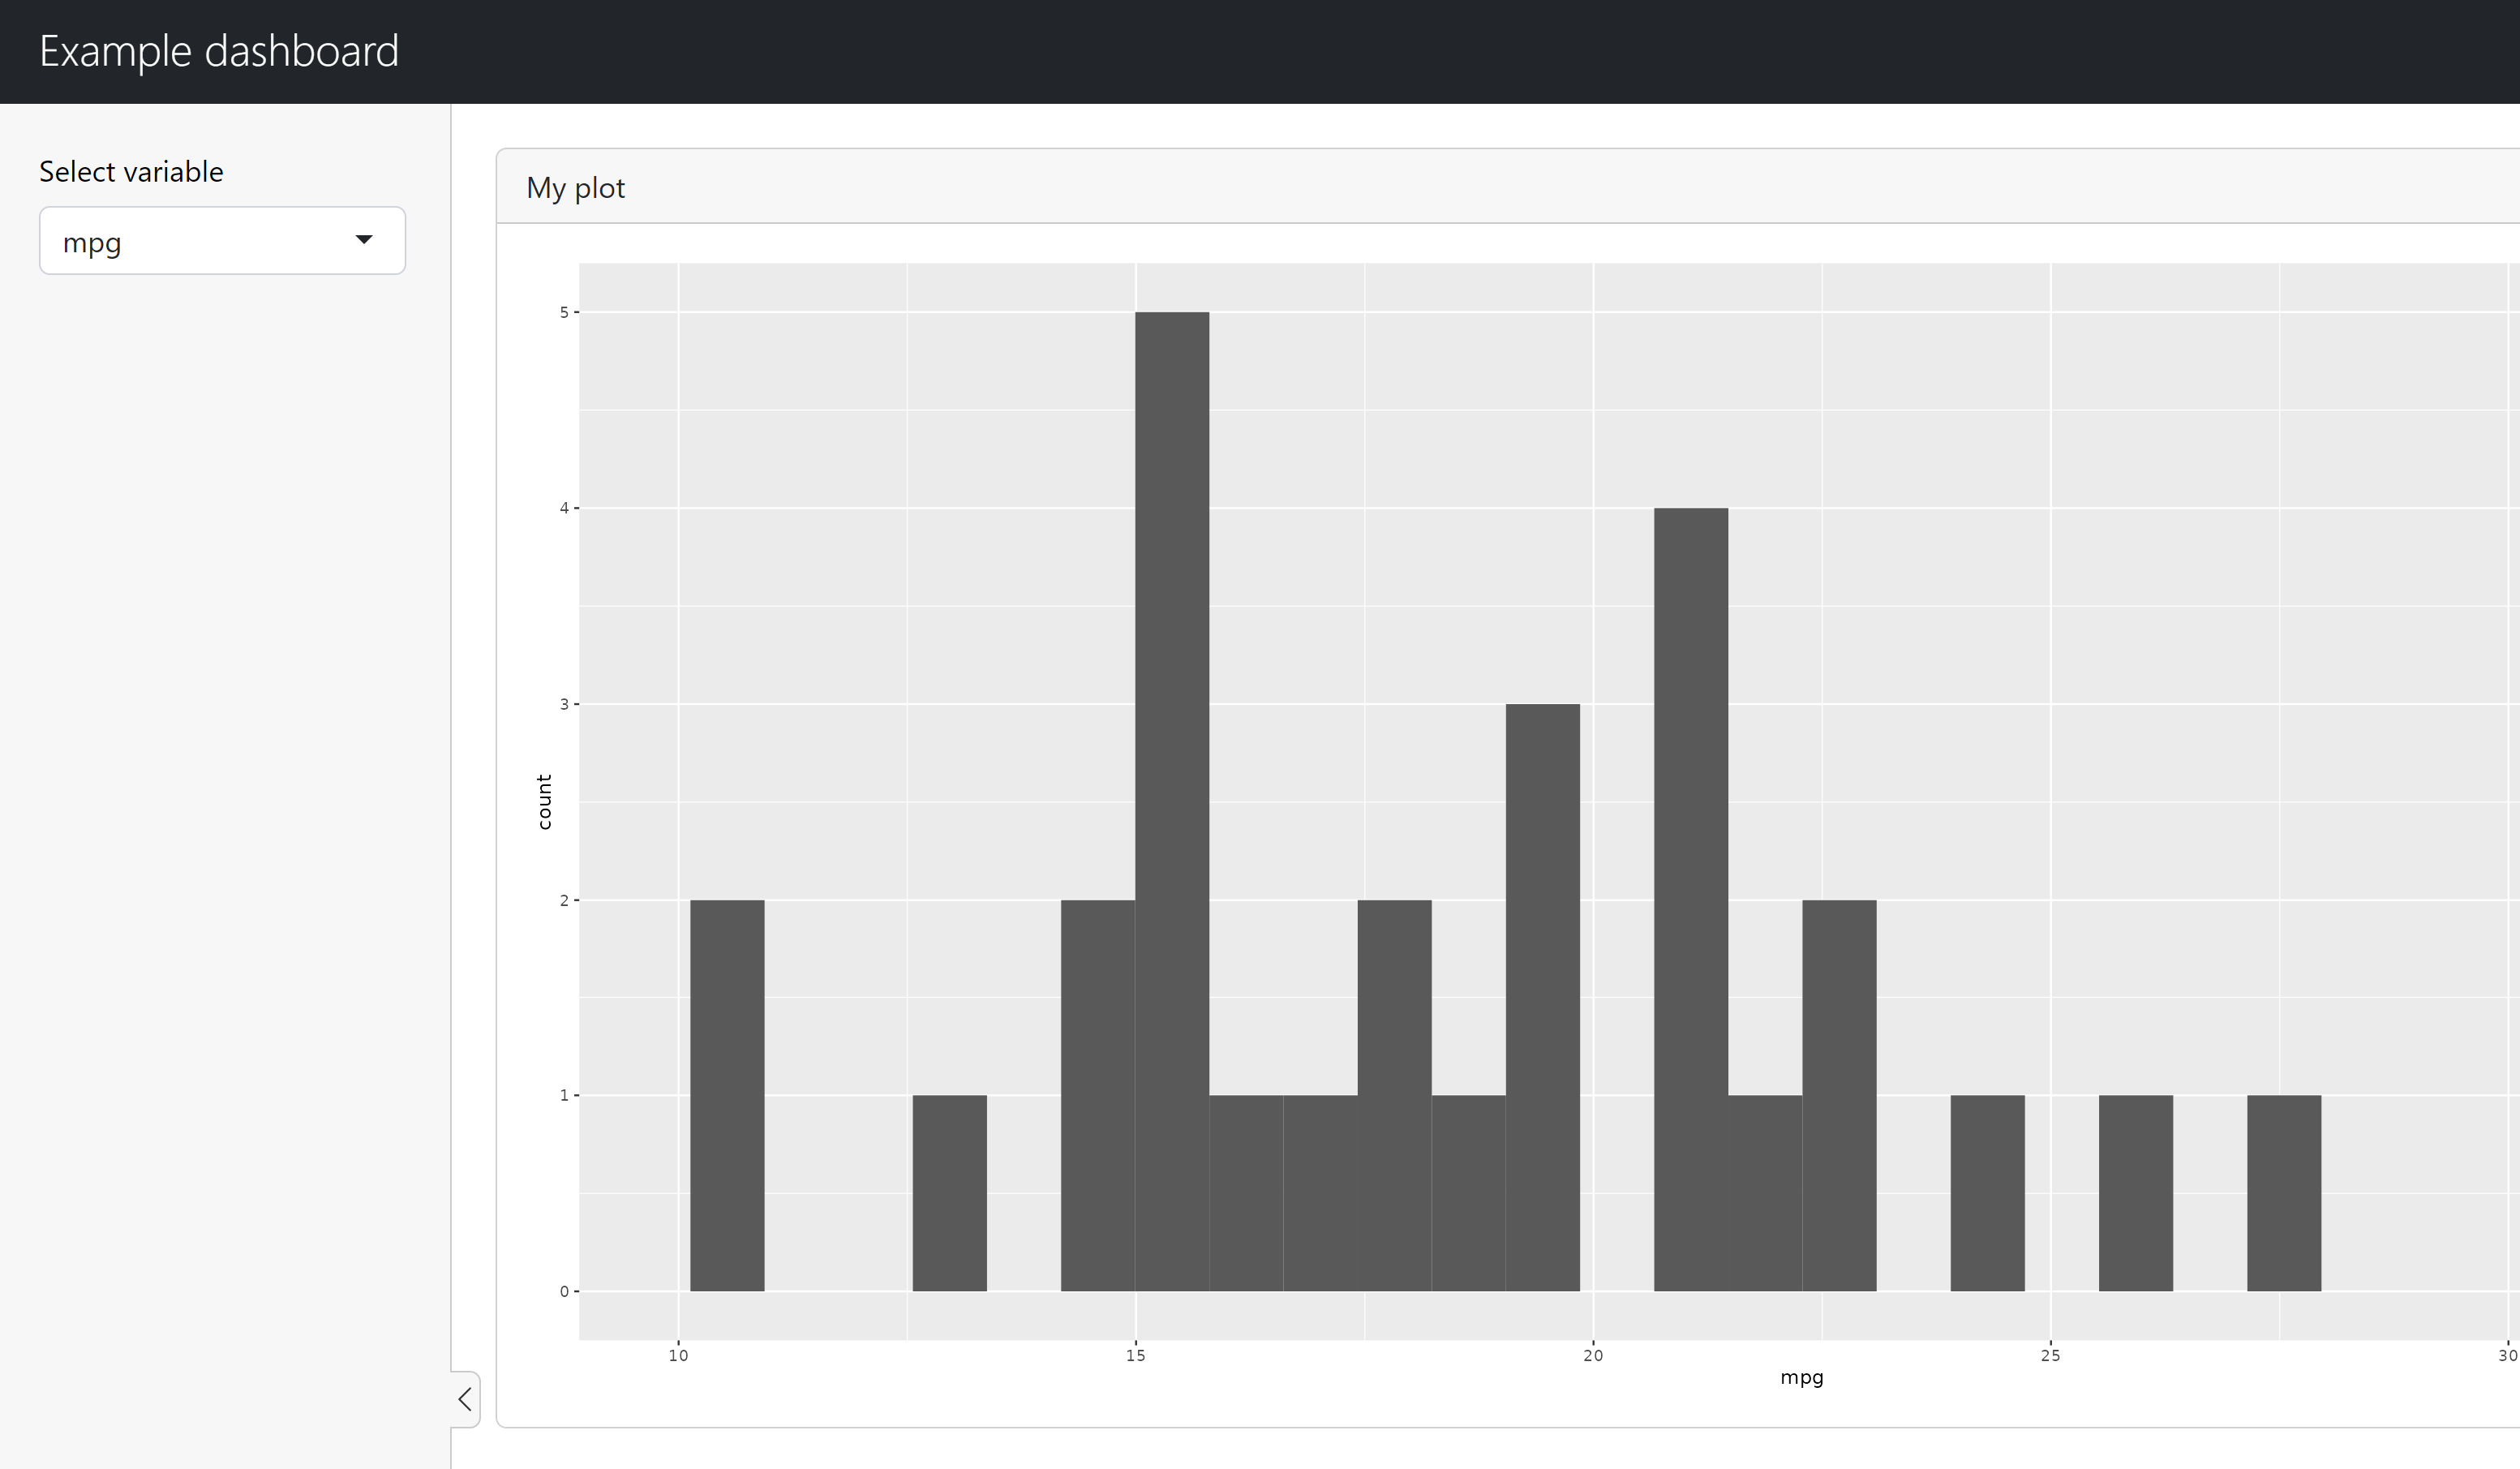
I’d like to move the little arrow that toggles the sidebar up to the top or basically just make it more visible/easier to close.

Example dashboard

  library(bslib)
  library(shiny)
  library(ggplot2)
  
  ui <- page_sidebar(
    title = "Example dashboard",
    sidebar = sidebar(
      varSelectInput("var", "Select variable", mtcars)
    ),
    card(
      full_screen = TRUE,
      card_header("My plot"),
      plotOutput("p")
    )
  )
  
  server <- function(input, output) {
    output$p <- renderPlot({
      ggplot(mtcars) + geom_histogram(aes(!!input$var))
    })
  }
  
  shinyApp(ui, server)
}

2

Answers


  1. You can shift the arrow to the top and also apply many more styling options using css. The container where the arrow is located in can be accessed by .bslib-sidebar-layout > .collapse-toggle and if you want to modify the icon itself you can add a > .collapse-icon afterwards. Here is one example. Including

    .bslib-sidebar-layout > .collapse-toggle {
        padding: 100px 0;
        margin-bottom: 350px;
        background-color: yellow;
    }
            
    .bslib-sidebar-layout > .collapse-toggle > .collapse-icon {
        fill: red !important;
    }
    

    yields:

    • a vertical larger container (padding),
    • the container shifted more towards the top (margin-bottom),
    • a yellow color of the container (background-color),
    • a red color of the arrow (fill).

    enter image description here

    library(bslib)
    library(shiny)
    library(ggplot2)
    
    
    ui <- page_sidebar(
        tags$head(tags$style(HTML(
            "
            .bslib-sidebar-layout > .collapse-toggle {
                padding: 100px 0;
                margin-bottom: 350px;
                background-color: yellow;
            }
            
            .bslib-sidebar-layout > .collapse-toggle > .collapse-icon {
                fill: red !important;
            }        
            "
        ))),
        title = "Example dashboard",
        sidebar = sidebar(
            varSelectInput("var", "Select variable", mtcars)
        ),
        card(
            full_screen = TRUE,
            card_header("My plot"),
            plotOutput("p")
        )
    )
    
    server <- function(input, output) {
        output$p <- renderPlot({
            ggplot(mtcars) + geom_histogram(aes(!!input$var))
        })
    }
    
    shinyApp(ui, server)
    }
    
    Login or Signup to reply.
  2. Nice answer by @Jan, as usual. Here is another possible answer. You can modify the function bslib:::collapse_icon.

    # bslib:::collapse_icon
    function () 
    {
      if (!is_installed("bsicons")) {
        icon <- "<svg xmlns="http://www.w3.org/2000/svg" viewBox="0 0 16 16" class="bi bi-chevron-down collapse-icon" style="fill:currentColor;" aria-hidden="true" role="img" ><path fill-rule="evenodd" d="M1.646 4.646a.5.5 0 0 1 .708 0L8 10.293l5.646-5.647a.5.5 0 0 1 .708.708l-6 6a.5.5 0 0 1-.708 0l-6-6a.5.5 0 0 1 0-.708z"></path></svg>"
        return(HTML(icon))
      }
      bsicons::bs_icon("chevron-down", class = "collapse-icon", 
                       size = NULL)
    }
    

    So, either you modify the SVG path, or you install the bsicons package and you change the Bootstrap icon. Since the function is not exported, you can modify it with assignInNamespace. Here I adopt the second way and I replace the chevron-down icon with the chevron-double-down icon, which is a bit more visible.

    library(shiny)
    library(bslib)
    library(ggplot2)
    
    assignInNamespace(
      "collapse_icon", 
      function() {
        bsicons::bs_icon(
          "chevron-double-down", class = "collapse-icon", size = NULL
        ) 
      },
      ns = "bslib"
    )
    
    ui <- page_sidebar(
      title = "Example dashboard",
      sidebar = sidebar(
        varSelectInput("var", "Select variable", mtcars)
      ),
      card(
        full_screen = TRUE,
        card_header("My plot"),
        plotOutput("p")
      )
    )
    
    server <- function(input, output) {
      output$p <- renderPlot({
        ggplot(mtcars) + geom_histogram(aes(!!input$var))
      })
    }
    
    shinyApp(ui, server)
    

    Maybe there’s a better Bootstrap icon. Otherwise use the other way: find a nice SVG icon (e.g. a filled triangle) and copy its code.

    enter image description here

    Login or Signup to reply.
Please signup or login to give your own answer.
Back To Top
Search