skip to Main Content

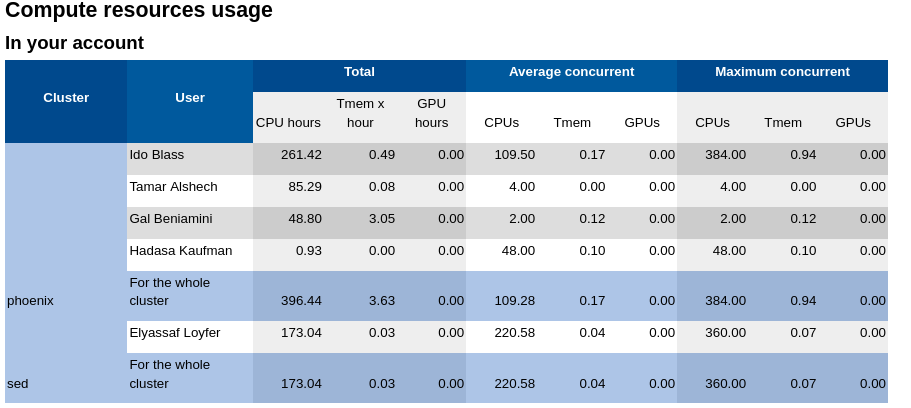
I am struggling with creating a pandas based html table that will look like the one in the attached picture. As you can see there are multiple table headers, colspans, rowspans, shadings, etc.

In more detail, I am developing a reporting system, and I want to be able to create engaging tables from data sets. The data sets themselves are just plain tables, but I want to be able to present them with multiple headers, grouping of repeating values, etc. I am currently using Jinja templates to do that, with some success but it is a very cumbersome solution. So I am looking for a way to use pandas instead but still be bale to use Jinja templates to a certain degree.

My question is, if anyone can point me to some material about doing that, and if there are existing tools that can be used along with pandas, to ease table formatting.

Many thanks

Oren

2

Answers


  1. Chosen as BEST ANSWER

    Just updating that pandas.io.formats.style.Styler gives me exactly what I wanted. It allows rendering dataframes into html while using jinja templates


  2. I use css style to generate html format from dataframe, not sur whether this meet your request.

    step1: prepare your dataframe
    step2: create css file and save in same folder of .py file
    step3: create html string to link the css file
    step4: use dataframe.to(html) to add the dataframe into html file

    below is my simple code, some private data is replace as XXXXX, you may use your own data instead

    Python Code

    #step1: prepare your dataframe
    nameTable={
        'fg':'Finish_Good',
        'mro':'MT_Spare_Parts',
        'pkg':'Packaging',
        'rm':'Raw_Material',
        'SMOI':'slow_moving'}
    
    df_out=pd.DataFrame()                                    
    df_out['name']=data['class'].map(nameTable)  
    
    #step3: create html string to link the css file
    pd.set_option('colheader_justify', 'center')    # FOR TABLE <th>
    html_string = '''
    <html>
      <head><title>HTML Pandas Dataframe with CSS</title></head>
      <link rel="stylesheet" type="text/css" href="df_style.css"/>
      <body>
        {table}
      </body>
    </html>
    '''
    #step4: use dataframe.to(html) to add the dataframe into html file
    html_file='###your file name####.html'
    with open(html_file, 'w') as f:
        f.write(html_string.format(table=df_out.to_html(classes='mystyle')))
    f.close()
    

    CSS file data, I jsut copy+paste for other place, you may test as well.
    css Code
    #step2: create css file and save in same folder of .py file

    /* includes alternating gray and white with on-hover color */
    .mystyle {
        font-size: 11pt; 
        font-family: Arial;
        border-collapse: collapse; 
        border: 1px solid silver;
    }
    .mystyle td, th {
        padding: 5px;
    }
    .mystyle tr:nth-child(even) {
        background: #E0E0E0;
    }
    .mystyle tr:hover {
        background: silver;
        cursor: pointer;
    }
    .mystyle tr:last-child{
        background:steelblue;
        color:#ffff;
    }
    
    Login or Signup to reply.
Please signup or login to give your own answer.
Back To Top
Search