


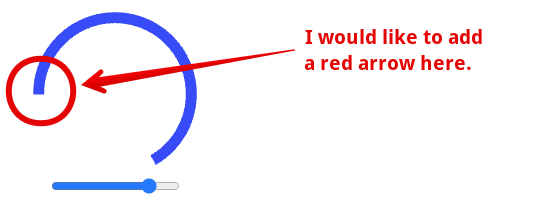
I am creating a gauge using svg.
Is there a way to add an arrow at the end of the animated gauge to indicate the entered value?
Since the gauge is displayed with the path’s stroke-dasharray, it seems that a marker cannot be applied according to the svg specification.
class arcGauge {
    constructor(targetEl) {
        this.el = targetEl;
        this.minmax = [];
        this.arcCoordinate = [];
        this.valueArcDataValue = 0;
        this.gaugeArc = document.createElementNS('http://www.w3.org/2000/svg', 'path');
    }

    // draw gauge
    init(data) {
        // set data
        this.viewBox = [0, 0, 110, 100];
        this.minmax = data.minmax || [];
        this.arcCoordinate = data.arcCoordinate || [120, 60];
        this.threshold = data.threshold || [];
        this.valueArcData = data.valueArcData;
        this.gaugeRadius = 42;
        this.gaugeStrokeWidth = 6;

        this._makeGauge();

    }

    _makeGauge() {
        const radius = this.gaugeRadius;

        let arcCoord = [];
        // coordinate
        this.arcCoordinate.forEach((ang) => {
            const radian = this._degreesToRadians(ang);
            const x = this.viewBox[2] / 2 + Math.cos(radian) * radius;
            const y = this.viewBox[2] / 2 + Math.sin(radian) * radius;
            arcCoord.push([x.toFixed(2), y.toFixed(2)]);
        });

        //arc
        this.gaugeArc.setAttribute('id', 'gaugeArc');
        this.gaugeArc.setAttribute('d', `M ${arcCoord[0][0]} ${arcCoord[0][1]} A ${radius} ${radius} 0 1 1  ${arcCoord[1][0]} ${arcCoord[1][1]}`);
        this.gaugeArc.setAttribute('fill', 'none');
        this.gaugeArc.setAttribute('stroke', this.valueArcData.color);
        this.gaugeArc.setAttribute('stroke-width', this.gaugeStrokeWidth);
        this.gaugeArc.setAttribute('transform', 'scale(-1, 1) translate(-110, 0)');

        let percentage = 0;
    percentage = this.valueArcData.value;

        this.gaugeArc.style.strokeDasharray = this._getArcLength(radius, 300, percentage);

        this.el.appendChild(this.gaugeArc);
    }

    // degree
    _degreesToRadians(degrees) {
        const pi = Math.PI;
        return degrees * (pi / 180);
    }
    // arc length
    _getArcLength(radius, degrees, val) {
        const radian = this._degreesToRadians(degrees);
        const arcLength = 2 * Math.PI * radius * (degrees / 360);
        const pathLength = arcLength * (val / 100);
        const dasharray = `${pathLength.toFixed(2)} ${arcLength.toFixed(2)}`;
        return dasharray;
    }


    // set gauge value
    setValue(v) {
            const baseValue = this.minmax[1] - this.minmax[0];
            const percentage = (v / baseValue) * 100;
            this.valueArcData.value = v;

            this.gaugeArc.style.strokeDasharray = this._getArcLength(this.gaugeRadius, 300, percentage);
            //gauge animation
            this.gaugeArc.style.transition = 'stroke-dasharray 1s ease-in-out';
    }

}


const arcGaugeData = {
  minmax: [0, 100],
  thresholdColor: ['#22b050', '#f4c141', '#e73621'],
  valueArcData: { type: 'arrow', color: '#3e3eff', value: 80 },
};
const arcGaugeIns = new arcGauge(document.querySelector('#chart'));
arcGaugeIns.init(arcGaugeData);

function changeArc(ipt) {
  arcGaugeIns.setValue(ipt.value);
}
.container {
display: flex;
flex-direction: column;
align-items: center;
justify-content: center;
width: 100%;
height: 100%;
}<div class="container">
<svg id="chart" xmlns="http://www.w3.org/2000/svg" width="180px" height="auto" viewBox="0 0 110 100"></svg>
<input type="range" min="0" max="100" step="1" value="80" onchange="changeArc(this)" />
</div>If this is not possible, please advise if there is an alternative.
2
Answers
The main idea is this:
you calculate the end point of the gauge using
getPointAtLengthand you move the arrow at this point.Also you calculate the angle of the path at the end point so that you can rotate the arrow accordingly.
In order to calculate the angle you will need 2 points:
•
point1i.e the end point of the gauge•
point2i.e a slightly offseted point (val + 0.1).This will work unless the value of the slider is 100. In this case I use the arrow as a marker.
Observation: This solution is not perfect. If you move the slider very fast you may get an offseted arrow.
In this example I just use a simple polygon as an arrow. The arrow is rotated from the center point.