skip to Main Content

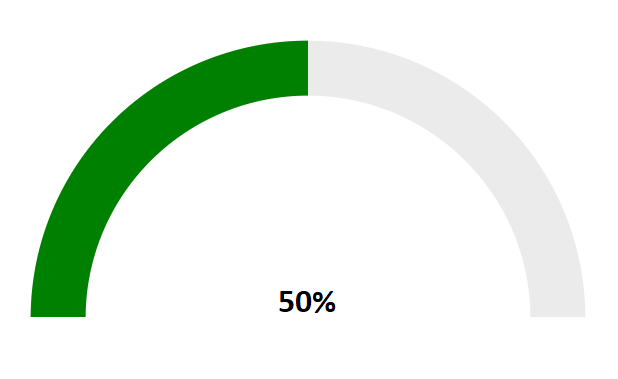
I have donut which is made in svg. I want to upgrade it to semi donut somehow.

.donut-ring {
    stroke: #EBEBEB;
}

.donut-segment-2 {
    stroke: green;
    animation: donut 1s;
}

@keyframes donut {
    0% {
        stroke-dasharray: 0, 100;
    }
    100% {
        stroke-dasharray: 25, 75;
    }
}
  <svg width="100%" height="100%" viewBox="0 0 40 40" class="donut">
    <circle class="donut-hole" cx="20" cy="20" r="15.91549430918954" fill="#fff"></circle>
    <circle class="donut-ring" cx="20" cy="20" r="15.91549430918954" fill="transparent" stroke-width="3.5"></circle>
    <circle class="donut-segment donut-segment-2" cx="20" cy="20" r="15.91549430918954" fill="transparent" stroke-width="3.5" stroke-dasharray="25 75" stroke-dashoffset="50"></circle>
  </svg>

Title (50%) is not essential, it is for clarity.
enter image description here

2

Answers


  1. Just clip away what you don’t want to see.

    .donut-ring {
        stroke: #EBEBEB;
    }
    
    .donut-segment-2 {
        stroke: green;
        animation: donut 1s;
    }
    
    @keyframes donut {
        0% {
            stroke-dasharray: 0, 100;
        }
        100% {
            stroke-dasharray: 25, 75;
        }
    }
    <svg width="100%" height="100%" viewBox="0 0 40 40" class="donut">
        <defs>
           <clipPath id="c">
             <rect width="40" height="20"/>
           </clipPath>
        </defs>
        <g clip-path="url(#c)">
        <circle class="donut-hole" cx="20" cy="20" r="15.91549430918954" fill="#fff"></circle>
        <circle class="donut-ring" cx="20" cy="20" r="15.91549430918954" fill="transparent" stroke-width="3.5"></circle>
        <circle class="donut-segment donut-segment-2" cx="20" cy="20" r="15.91549430918954" fill="transparent" stroke-width="3.5" stroke-dasharray="25 75" stroke-dashoffset="50"></circle>
        </g>
      </svg>
    Login or Signup to reply.
  2. I wrote a small Web Component to do Pie Charts: https://pie-meister.github.io/

    With some extra CSS everyone who can do HTML can create a chart:

    <script src="https://pie-meister.github.io/PieMeister.min.js"></script>
    
    <pie-chart stroke-width="200" pull="-200">
        <style>
          svg {
            background:pink;
            transform:rotate(-90deg);
          }
          [hide], text {
            display:none
          }
        </style>
        <slice size="20"></slice>
        <slice size="30"></slice>
        <slice hide size="50"></slice>
     </pie-chart>
    Login or Signup to reply.
Please signup or login to give your own answer.
Back To Top
Search