skip to Main Content

I am working with the R programming language.

I found this link which has historical population pyramids for Canada: https://www12.statcan.gc.ca/census-recensement/2021/dp-pd/dv-vd/pyramid/index-en.htm

enter image description here

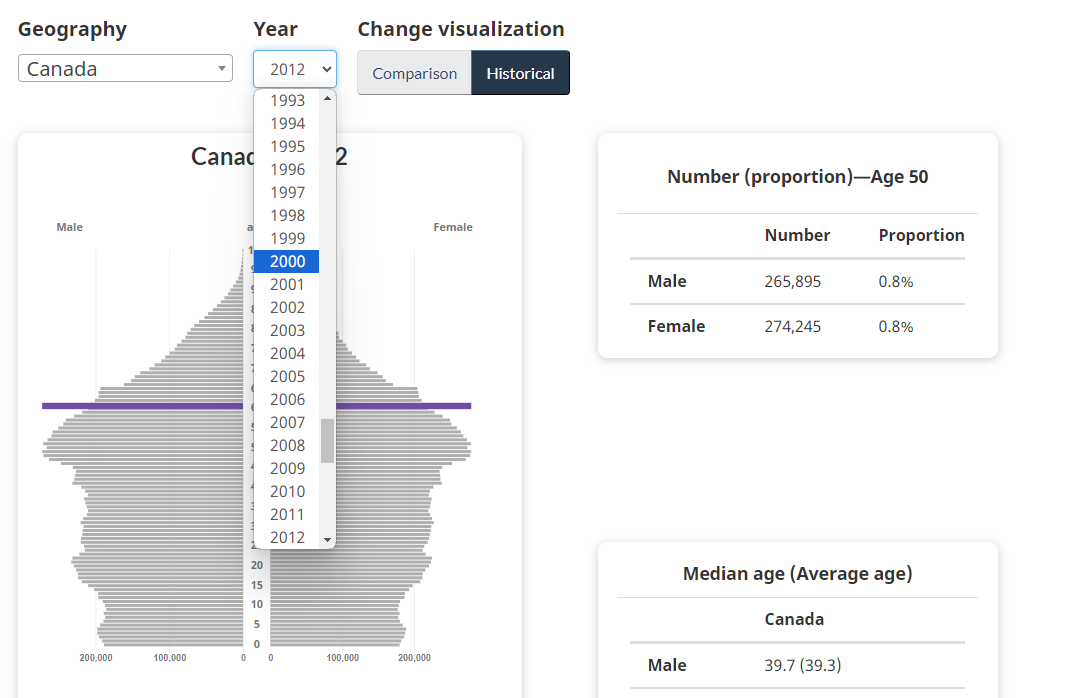
My Question: For every year in the drop down scroll menu (i.e. 1851 – 2043), I want to get the age-gender breakdowns. This would look something like this:

   year gender  age percent_of_population
1  1975   Male   25                    3%
2  1975 Female   25                    2%
3  1975   Male   26                    1%
4  1975 Female   26                    2%
5  ....   ....  ...                   ...
6  1976   Male   25                    4%
7  1976 Female   25                    3%
8  1976   Male   26                    2%
9  1976 Female   26                    1%
10  ...    ... ....                   ,,,

So far, I am trying to look if the website itself has some button which will allow you to directly download the age-gender breakdowns for all years… but it seems I can only look at very limited information from each year.

Apart from that, I have started to "inspect" the source code of the website – but I see no "tags" that I might be able to use to understand the structure of this website.

Can someone please show me how I can solve this problem? Maybe Selenium can be useful for this?

Thanks!

2

Answers


  1. You can download the data here.

    Login or Signup to reply.
  2. Javascript that renders charts and tables fetches data from API endpoints, the one with age-gender breakdowns is rest/dataviz/HistoricPyramid.json:

    library(dplyr)
    
    jsonlite::fromJSON("https://www12.statcan.gc.ca/rest/dataviz/HistoricPyramid.json?dguid=2021A000011124&minYr=1975&maxYr=2043") %>% 
      as_tibble() %>% 
      arrange(YR, AGE)
    #> # A tibble: 6,969 × 7
    #>    DGUID            AGE   MALE FEMALE MALEPERCENT FEMALEPERCENT    YR
    #>    <chr>          <int>  <int>  <int>       <dbl>         <dbl> <int>
    #>  1 2021A000011124     0 178580 169805       0.787         0.748  1975
    #>  2 2021A000011124     1 175990 167720       0.775         0.739  1975
    #>  3 2021A000011124     2 178500 169185       0.786         0.745  1975
    #>  4 2021A000011124     3 182120 172565       0.802         0.760  1975
    #>  5 2021A000011124     4 190550 181525       0.840         0.800  1975
    #>  6 2021A000011124     5 191365 182020       0.843         0.802  1975
    #>  7 2021A000011124     6 186855 177610       0.823         0.783  1975
    #>  8 2021A000011124     7 188990 180695       0.833         0.796  1975
    #>  9 2021A000011124     8 201415 192215       0.887         0.847  1975
    #> 10 2021A000011124     9 212545 203455       0.936         0.896  1975
    #> # ℹ 6,959 more rows
    

    Created on 2023-08-04 with reprex v2.0.2

    Login or Signup to reply.
Please signup or login to give your own answer.
Back To Top
Search