


I understood that I have to use the following line but I don’t know how to use it in SwiftUI : chart.xAxis.forceLabelsEnabled = true
Here is my charts :
var sampleData: [Int] = [0, 1, 2, 3, 4, 5, 6, 7, 8, 9, 10, 11]
Chart {
                    ForEach(sampleData.indices, id: .self) { index in
                        BarMark(x: .value("x", String(Calendar.current.monthSymbols[index].prefix(3))),
                                y: .value("y", index))
                    }
                }
                .chartYAxis(.hidden)
                .frame(height: 180)
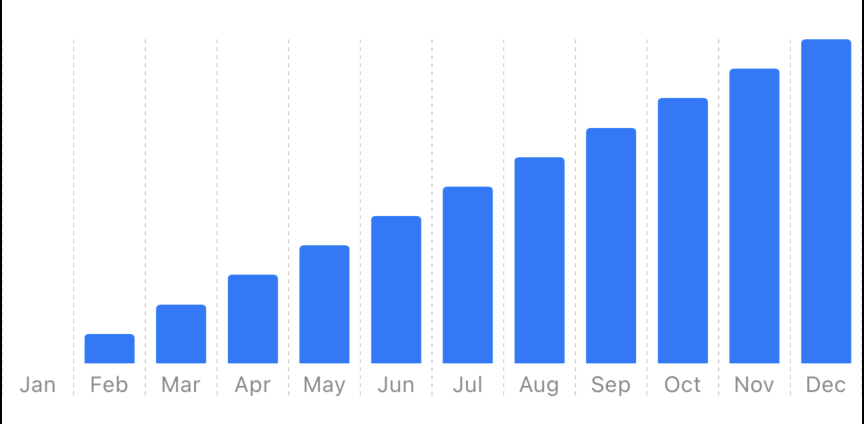
With the result :
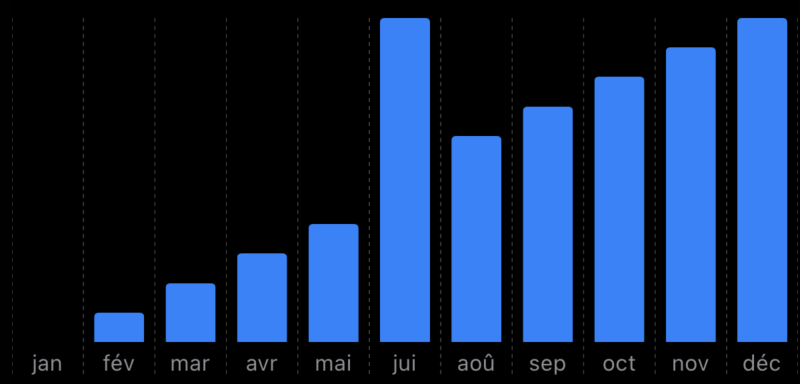
In french, June = Juin and July = Juillet.
As the first 3 letters of JUIN and JUILLET are the same then the fusion values. One of the solutions is to put .prefix(4) but that’s not what I want
Result in French :
2
Answers
To make this work you need, as noted, to keep the x values unique and therefore we need to build the label for the x axis separately using
.chartXAxisFirst change the
BarMarkto use the index as the x valueWe need to make it a string to match the type we will be using below as the label data.
Then add a new modifier to
ChartYou should not give your data duplicate X values in the first place. Since your data is date-based, actually create some
Dates. For example:Then, if you want to format some of them to the same strings, that is totally possible:
where
monthNamesis an array, e.g.That said, I would recommend using the built-in date formats: