skip to Main Content

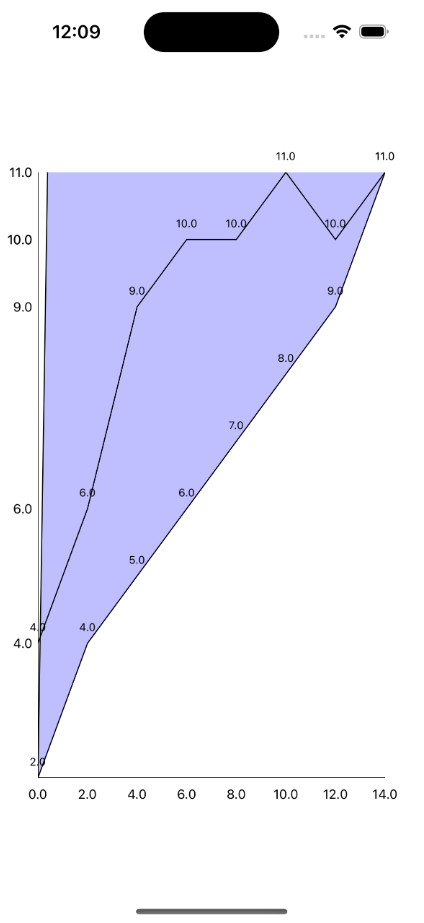
I have three arrays. xValues, yMinValues and yMaxValues. I want to show a graphic and this graphic must draw two lines by my yminValues and yMaxValues array.Then fill with a color between this lines. I draw all lines but I get a graphic like in that photo and I show

My Code is :
enter image description here

class CustomView: UIView {
    let xValues: [CGFloat] = [0, 2, 4, 6, 8, 10, 12, 14]
    let yMaxValues: [CGFloat] = [4, 6, 9, 10, 10, 11, 10, 11]
    let yMinValues: [CGFloat] = [2, 4, 5, 6, 7, 8, 9, 11]
    
    override func draw(_ rect: CGRect) {
        super.draw(rect)
        
        guard let context = UIGraphicsGetCurrentContext() else { return }
        
        // Arka planı beyaz yapın
        UIColor.white.setFill()
        context.fill(rect)
        
        // Grafik boyutlarını alın
        let graphWidth = rect.width
        let graphHeight = rect.height
        
        // Min ve max değerleri belirleyin
        let minValue = min(yMinValues.min() ?? 0.0, yMinValues.max() ?? 0.0)
        let maxValue = max(yMaxValues.min() ?? 0.0, yMaxValues.max() ?? 0.0)
        
        // Y değerlerini ölçeklendirin
        let yScaleFactor = graphHeight / (maxValue - minValue)
        
        // X değerlerini ölçeklendirin
        let xScaleFactor = graphWidth / CGFloat(xValues.count - 1)
        
        // Grafik alanını doldurun
        let yFillValuesPath = UIBezierPath()

        // YFillValues için line çizin
        for i in 0..<xValues.count {
            let x = CGFloat(i) * xScaleFactor
            let yFill = graphHeight - (yMinValues[i] - minValue) * yScaleFactor // Burada yMinValues kullanılmalı
            if i == 0 {
                yFillValuesPath.move(to: CGPoint(x: x, y: yFill))
            } else {
                yFillValuesPath.addLine(to: CGPoint(x: x, y: yFill))
            }

            // Noktalara yFillValues değerlerini yaz
            let pointLabel = UILabel(frame: CGRect(x: x - 15, y: yFill - 30, width: 30, height: 30))
            pointLabel.text = "(yMinValues[i])"
            pointLabel.textColor = UIColor.black
            pointLabel.textAlignment = .center
            pointLabel.font = UIFont.systemFont(ofSize: 10)
            addSubview(pointLabel)
        }
        
        // Grafik alanını doldurun
        let fillColor = UIColor(red: 0.5, green: 0.5, blue: 1.0, alpha: 0.5)
        fillColor.setFill()
        
        yFillValuesPath.addLine(to: CGPoint(x: yMaxValues.last ?? 0, y: graphHeight - (yMaxValues.last ?? 0 - minValue) * yScaleFactor)) // yMinValues kullanılmalı
        yFillValuesPath.addLine(to: CGPoint(x: yMinValues.first ?? 0, y: graphHeight - (yMinValues.first ?? 0 - maxValue) * yScaleFactor)) // yMinValues kullanılmalı
    
        
        yFillValuesPath.fill()

        yFillValuesPath.close()
        
        // YValues için line çizin
        let yValuesPath = UIBezierPath()
        for i in 0..<xValues.count {
            let x = CGFloat(i) * xScaleFactor
            let y = graphHeight - (yMaxValues[i] - minValue) * yScaleFactor
            if i == 0 {
                yValuesPath.move(to: CGPoint(x: x, y: y))
            } else {
                yValuesPath.addLine(to: CGPoint(x: x, y: y))
            }
            
            // Noktalara yValues değerlerini yaz
            let pointLabel = UILabel(frame: CGRect(x: x - 15, y: y - 30, width: 30, height: 30))
            pointLabel.text = "(yMaxValues[i])"
            pointLabel.textColor = UIColor.black
            pointLabel.textAlignment = .center
            pointLabel.font = UIFont.systemFont(ofSize: 10)
            addSubview(pointLabel)
        }
        
        // Çizgileri çizin
        let lineColor = UIColor.black.cgColor
        context.setStrokeColor(lineColor)
        yValuesPath.stroke()
        yFillValuesPath.stroke()
        
        // X ekseni çizin
        context.move(to: CGPoint(x: 0, y: graphHeight))
        context.addLine(to: CGPoint(x: graphWidth, y: graphHeight))
        context.strokePath()
        
        // Y ekseni çizin
        context.move(to: CGPoint(x: 0, y: graphHeight))
        context.addLine(to: CGPoint(x: 0, y: 0))
        context.strokePath()
        
        // X değerlerini gösterin
        for i in 0..<xValues.count {
            let x = CGFloat(i) * xScaleFactor
            let label = UILabel(frame: CGRect(x: x - 15, y: graphHeight + 5, width: 30, height: 20))
            label.text = "(xValues[i])"
            label.textColor = UIColor.black
            label.textAlignment = .center
            label.font = UIFont.systemFont(ofSize: 12)
            addSubview(label)
        }
        
        // Y değerlerini gösterin
        for i in 0..<yMaxValues.count {
            let y = graphHeight - (yMaxValues[i] - minValue) * yScaleFactor
            let label = UILabel(frame: CGRect(x: -35, y: y - 10, width: 30, height: 20))
            label.text = "(yMaxValues[i])"
            label.textColor = UIColor.black
            label.textAlignment = .right
            label.font = UIFont.systemFont(ofSize: 12)
            addSubview(label)
        }
    }
}

I want to show a graphic filled with a color between yMinValues array and yMaxValues.

enter image description here : I don’t want to fill outer fields and marked these fields with text in this photo.
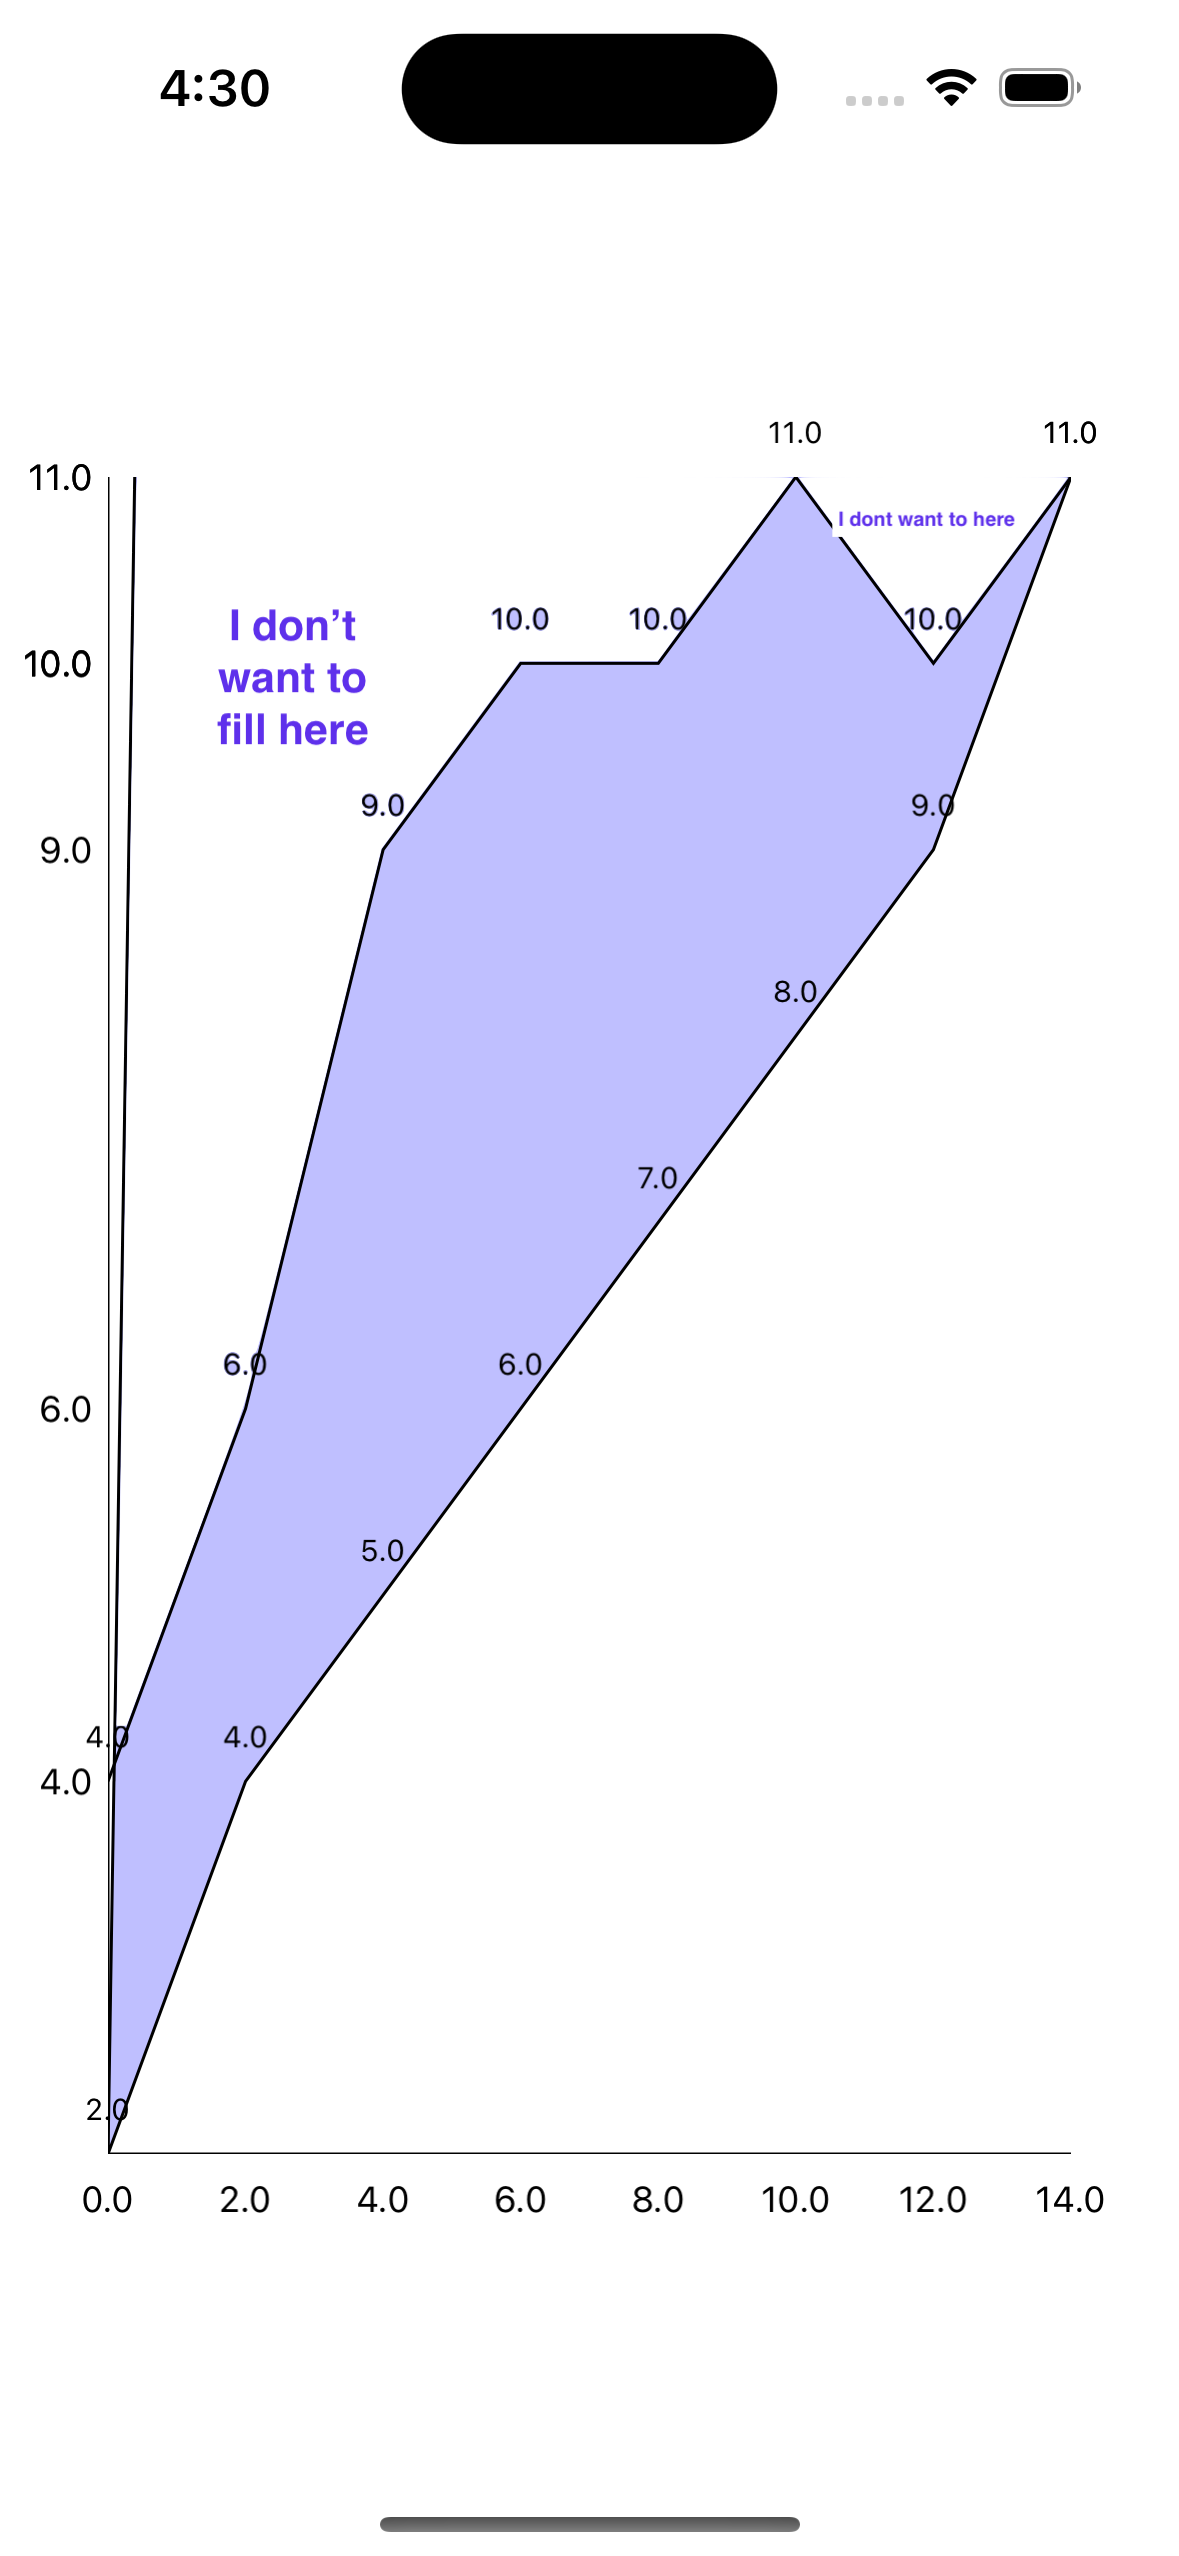
2

Answers


  1. Just draw small rectangle corresponding to (X[n],Ymin[n])/(X[n],Ymax[n])/(X[n+1],Ymax[n+1])/(X[n+1],Ymin[n+1]). Then you can stroke the X,Ymin and X,Ymax lines

    ...
        //        yFillValuesPath.fill() <<-- Remove the fill
    ... 
        // Loop on values
        for i in 1..<xValues.count {
            // Compute path points
            let x0 = CGFloat(i-1) * xScaleFactor
            let x1 = CGFloat(i) * xScaleFactor
            let yMax0 = graphHeight - (yMaxValues[i-1] - minValue) * yScaleFactor
            let yMax1 = graphHeight - (yMaxValues[i] - minValue) * yScaleFactor
            let yMin0 = graphHeight - (yMinValues[i-1] - minValue) * yScaleFactor
            let yMin1 = graphHeight - (yMinValues[i] - minValue) * yScaleFactor
            
            // Fill path
            context.beginPath()
            context.move(to: CGPoint(x: x0, y: yMin0))
            context.addLine(to: CGPoint(x: x0, y: yMax0))
            context.addLine(to: CGPoint(x: x1, y: yMax1))
            context.addLine(to: CGPoint(x: x1, y: yMin1))
            context.closePath()
            context.fillPath() // Fill path without stroke
        }
    
    Login or Signup to reply.
  2. To fill the area between the lines, we need to create a single path.

    So, we start with a "max values line" – actually, a set of points:

    enter image description here

    then we have a "min values line" – also, a set of points:

    enter image description here

    to fill the space, we need to turn those into a single path, in this order:

    enter image description here

    then we can fill and stroke it:

    enter image description here

    Here is your CustomView class, with a few modifications…

    class CustomView: UIView {
        let xValues: [CGFloat] = [0, 2, 4, 6, 8, 10, 12, 14]
        let yMaxValues: [CGFloat] = [4, 6, 9, 10, 10, 11, 10, 11]
        let yMinValues: [CGFloat] = [2, 4, 5, 6, 7, 8, 9, 11]
        
        override func draw(_ rect: CGRect) {
            super.draw(rect)
            
            guard let context = UIGraphicsGetCurrentContext() else { return }
            
            // Arka planı beyaz yapın
            UIColor.white.setFill()
            context.fill(rect)
            
            // Grafik boyutlarını alın
            let graphWidth = rect.width
            let graphHeight = rect.height
            
            // Min ve max değerleri belirleyin
            let minValue = min(yMinValues.min() ?? 0.0, yMinValues.max() ?? 0.0)
            let maxValue = max(yMaxValues.min() ?? 0.0, yMaxValues.max() ?? 0.0)
            
            // Y değerlerini ölçeklendirin
            let yScaleFactor = graphHeight / (maxValue - minValue)
            
            // X değerlerini ölçeklendirin
            let xScaleFactor = graphWidth / CGFloat(xValues.count - 1)
            
            var yMinPoints: [CGPoint] = []
            var yMaxPoints: [CGPoint] = []
    
            // build CGPoint arrays for min and max values points
            for i in 0..<xValues.count {
                let x = CGFloat(i) * xScaleFactor
                let yMin = graphHeight - (yMinValues[i] - minValue) * yScaleFactor
                let yMax = graphHeight - (yMaxValues[i] - minValue) * yScaleFactor
                yMinPoints.append(.init(x: x, y: yMin))
                yMaxPoints.append(.init(x: x, y: yMax))
            }
            
            // Grafik alanını doldurun
            let yFillValuesPath = UIBezierPath()
    
            // build path, starting at first max point
            yFillValuesPath.move(to: yMaxPoints[0])
            // add lines to the remaing max points
            for i in 1..<yMaxPoints.count {
                yFillValuesPath.addLine(to: yMaxPoints[i])
            }
            // reverse the max points
            let yMinReversed = Array(yMinPoints.reversed())
            // add lines to the reversed max points
            for i in 0..<yMinReversed.count {
                yFillValuesPath.addLine(to: yMinReversed[i])
            }
            
            // close the path
            yFillValuesPath.close()
            
            // fill the path
            let fillColor = UIColor(red: 0.0, green: 0.5, blue: 1.0, alpha: 0.5)
            fillColor.setFill()
            yFillValuesPath.fill()
            
            // stroke the path
            let lineColor = UIColor.black
            lineColor.setStroke()
            yFillValuesPath.stroke()
    
            // add the point labels
            for i in 0..<yMaxPoints.count {
                // Noktalara yFillValues değerlerini yaz
                var pointLabel = UILabel(frame: CGRect(x: yMaxPoints[i].x - 15, y: yMaxPoints[i].y - 30, width: 30, height: 30))
                pointLabel.text = "(yMaxValues[i])"
                pointLabel.textColor = UIColor.black
                pointLabel.textAlignment = .center
                pointLabel.font = UIFont.systemFont(ofSize: 10)
                addSubview(pointLabel)
    
                pointLabel = UILabel(frame: CGRect(x: yMinPoints[i].x - 15, y: yMinPoints[i].y - 30, width: 30, height: 30))
                pointLabel.text = "(yMinValues[i])"
                pointLabel.textColor = UIColor.black
                pointLabel.textAlignment = .center
                pointLabel.font = UIFont.systemFont(ofSize: 10)
                addSubview(pointLabel)
            }
    
            // X ekseni çizin
            context.move(to: CGPoint(x: 0, y: graphHeight))
            context.addLine(to: CGPoint(x: graphWidth, y: graphHeight))
            context.strokePath()
            
            // Y ekseni çizin
            context.move(to: CGPoint(x: 0, y: graphHeight))
            context.addLine(to: CGPoint(x: 0, y: 0))
            context.strokePath()
            
            // X değerlerini gösterin
            for i in 0..<xValues.count {
                let x = CGFloat(i) * xScaleFactor
                let label = UILabel(frame: CGRect(x: x - 15, y: graphHeight + 5, width: 30, height: 20))
                label.text = "(xValues[i])"
                label.textColor = UIColor.black
                label.textAlignment = .center
                label.font = UIFont.systemFont(ofSize: 12)
                addSubview(label)
            }
            
            // Y değerlerini gösterin
            for i in 0..<yMaxValues.count {
                let y = graphHeight - (yMaxValues[i] - minValue) * yScaleFactor
                let label = UILabel(frame: CGRect(x: -35, y: y - 10, width: 30, height: 20))
                label.text = "(yMaxValues[i])"
                label.textColor = UIColor.black
                label.textAlignment = .right
                label.font = UIFont.systemFont(ofSize: 12)
                addSubview(label)
            }
        }
    }
    

    Result:

    enter image description here

    Login or Signup to reply.
Please signup or login to give your own answer.
Back To Top
Search