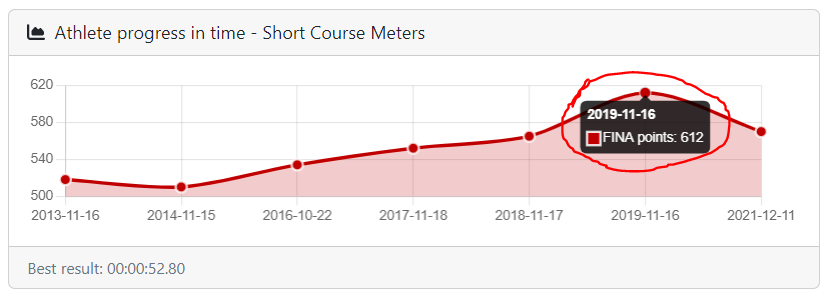
I want to change labels in a chart created in ChartJS in a Flask application. Namely:
- I render template and pass object results_lc with 3 attributes: date, points and time.
- Using chartJS I have created chart where on X axis I have dates (labels) and on Y axis I have points.
- Now my problem is that particular points labels are also points, but instead of them I want to have times.
Below is my code:
            <script>
                var ctx = document.getElementById("myAreaChart");
                var myLineChart = new Chart(ctx, {
                  type: 'line',
                  data: {
                    labels:
                    [{% for result in results_lc %}
                        '{{ result.date }}',
                    {% endfor %}],
                    datasets: [{
                      label: "FINA points",
                      lineTension: 0.3,
                      backgroundColor: "rgba(2,117,216,0.2)",
                      borderColor: "rgba(2,117,216,1)",
                      fill: true,
                      pointRadius: 5,
                      pointBackgroundColor: "rgba(2,117,216,1)",
                      pointBorderColor: "rgba(255,255,255,0.8)",
                      pointHoverRadius: 5,
                      pointHoverBackgroundColor: "rgba(2,117,216,1)",
                      pointHitRadius: 50,
                      pointBorderWidth: 2,
                      data: [
                      {% for result in results_lc %}
                        {{ result.fina_points }},
                    {% endfor %}],
                    }],
                  },
                  options: {
                    plugins: {
                      legend: {
                        display: false
                      }
                    }
                  }
                });
            </script>
Thanks in advance!
Here instead of FINA points: 612 I want to have: swimtime: 00:52,80.
Either FINA points and swimtime are passed in the list of dictionaries to the template.
I have tried different approaches but none of them worked :<


2
Answers
In new Chart you have a prop called datasets.label: FINA points. Change this to respective label that you want.
What you have indicated you wanted to change is the tooltip. It can be configured in many ways, as you can see from the docs.
But first you have to send the
timesfrom python to the script. One way to do that is to just declare a new variable, at the beginning of your script, following your approach for the other two components (I suppose this is not user data and you trust it):Then you continue the script as before, with
var ctx = ...,but add in the chart configuration under
pluginsthe configuration for the tooltip with a customlabelcallback:That should do it.