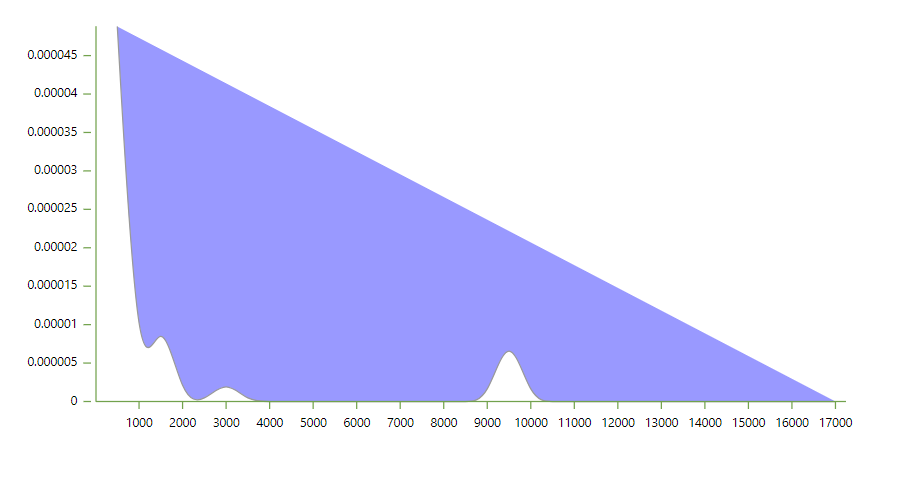
I’m trying to build a Density Plot using React and D3.js.
I would like the user to be able to hover on any part of the graph and see a tooltip displaying additional info on that specific point, but I’m not sure how I would add tooltips to the path element. I couldn’t find any relevant examples. Has somebody worked on something similar?
Code: https://playcode.io/1640953
import {useMemo, useRef } from "react";
import * as d3 from "d3";

import  AxisBottom  from "./axisBottom";
import  AxisLeft  from "./axisTop";
import importedData from "./data"

const MARGIN = { top: 50, right: 30, bottom: 50, left: 50 };


export const DensityChart = ({ width = 700, height = 400}) => {
  const boundsWidth = width - MARGIN.right - MARGIN.left;
  const boundsHeight = height - MARGIN.top - MARGIN.bottom;

  const refs = useRef({
    dataMin: Math.min(...importedData),
    dataMax: Math.max(...importedData),
    domain: [Math.min(...importedData), Math.max(...importedData)]
  })

  const xScale = useMemo(() => {
    try {
      const result = d3.scaleLinear().domain([refs.current.dataMin, refs.current.dataMax]).range([10, boundsWidth - 10]);
      return result
    } catch (error) {
      console.error("Error creating xScale:", error);
      return d3.scaleLinear().domain([0, 1]).range([10, boundsWidth - 10]);
    }
  }, [importedData, width]);

    // Compute kernel density estimation
    const density = useMemo(() => {
      const kde = kernelDensityEstimator(kernelEpanechnikov(7), xScale.ticks(40));
      return kde(importedData);
    }, [xScale, importedData]);

  const yScale = useMemo(() => {
    try {
      const max = Math.max(...density.map((d) => d[1]));
      const result = d3.scaleLinear().range([boundsHeight, 0]).domain([0, max])
      return result;
    } catch (error) {
      console.error("Error creating yScale:", error);
      return
    }
  }, [importedData, height, density]);

  const path = useMemo(() => {
    try {
      const lineGenerator = d3.line().x((d) => {
       return xScale(d[0])
      })
      .y((d) => {
        return yScale(d[1])
      })
      .curve(d3.curveBasis);
      return lineGenerator(density);
    } catch (error) {
      console.error("Error creating path:", error);
      return "";
    }
  }, [density, xScale, yScale]);


  return (
    <section>
    <svg height="500" width="700">
      <g
        width={boundsWidth}
        height={boundsHeight}
        transform={`translate(${[MARGIN.left, MARGIN.top].join(",")})`}
      >

        <path
          d={path}
          fill="blue"
          opacity={0.4}
          stroke="black"
          strokeWidth={1}
          strokeLinejoin="round"
        />
        <g transform={`translate(0, ${boundsHeight})`}>
          <AxisLeft yScale={yScale} pixelsPerTick={40} />
        </g>
        <g transform={`translate(0, ${boundsHeight})`}>
          <AxisBottom xScale={xScale} pixelsPerTick={40} />
        </g>

      </g>
    </svg>
    </section>
  );
}

export default DensityChart;

// Function to compute density
function kernelDensityEstimator(kernel, X) {
  return function(V) {
    return X.map(function(x) {
      return [x, d3.mean(V, function(v) { return kernel(x - +v )})];
    });
  };
}
function kernelEpanechnikov(bandwidth) {
  return function(v) {
    const result = Math.abs(v /= bandwidth) <= 1 ? 0.75 * (1 - v * v) / bandwidth : 0;
    return result
  };
}


2
Answers
Realistically your problem does not really have anything to do with d3. It can be resolved with normal javascript. SVG path still respect pointer events normally (as long as they have fill color or pointer event explicitly defined)
For instance using css to make path sections change color:
You can add javascript events the same way:
So you can either use simple css to show a tooltip or even javascript for more custom tooltip behaviour.
I had found error in X-Axis, I updated Code and Now it’s show correct way.
d3.scaleLinear().domain([refs.current.dataMin, refs.current.dataMax])to
d3.scaleLinear().domain([0 refs.current.dataMax])