skip to Main Content

I have a radar chart made using Chart.js and I would like to change the color of the tick label when hovering over it. It’s been a couple of days I’ve tried almost everything.

I tried using the onmousemove event handler or the onHover callback but nothing worked. The only thing I managed is to change the cursor when hovering over the tick labels. Is there anything I can do to implement this behaviour?

Edit

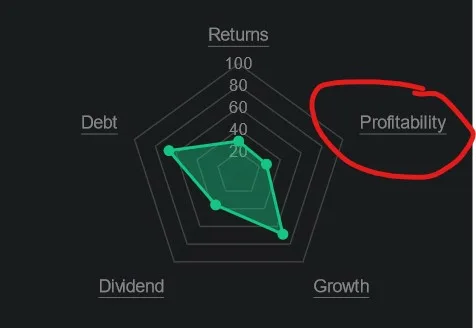
What I mean by "tick label" is what I highlighted in the following picture:

enter image description here

2

Answers


  1. There is a workaround to change the colour of text on the hover of the label.

    var radarChart = new Chart(document.getElementById('radarChart'), {
    type: 'radar',
    data: {
        labels: ['Label 1', 'Label 2', 'Label 3', 'Label 4', 'Label 5'],
        datasets: [{
            label: 'Dataset 1',
            data: [10, 20, 15, 25, 30],
            backgroundColor: 'rgba(75, 192, 192, 0.2)',
            borderColor: 'rgba(75, 192, 192, 1)',
            borderWidth: 2
        }]
    },
    options: {
        plugins: {
            tooltip: {
                callbacks: {
                    label: function (context) {
                        // Change the color of the label when hovering
                        return {
                            label: context.chart.data.labels[context.dataIndex],
                            borderColor: 'rgba(255, 0, 0, 1)', // Change the color as needed
                            backgroundColor: 'rgba(255, 0, 0, 0.2)' // Change the color as needed
                        };
                    }
                }
            }
        },
        interaction: {
            mode: 'index',
            intersect: false,
        },
        onHover: function (event, chart) {
            // Change the color of the tick label when hovering
            chart.options.scales.r.ticks.color = 'rgba(255, 0, 0, 1)'; // Change the color as needed
            chart.update();
        },
        scales: {
            r: {
                ticks: {
                    color: 'rgba(0, 0, 0, 1)' // Set the default color of the tick label
                }
            }
        }
    }
    });
    

    Do try this and let me know if you need any more help.

    Login or Signup to reply.
  2. In Chart.js, for a radar chart, the "tick labels" can refer to the labels on the axes that extend from the center of the chart to the outer edges. If you want to change the color of these labels when hovering over them, you can use a combination of the onHover callback and the getElementsAtEvent method.

    onHover: function (event, chart) {
    var point = chart.getElementAtEvent(event);

    if (point.length > 0) {
        var index = point[0].index;
        var scaleId = point[0].scale.id;
    
        var tickLabel = chart.scales[scaleId].getLabelForValue(index);
    
        if (tickLabel) {
            tickLabel.fillStyle = 'red';
            chart.draw();  // Use draw() instead of update() for efficiency
        }
    }
    

    }

    Login or Signup to reply.
Please signup or login to give your own answer.
Back To Top
Search