skip to Main Content

I’m in the process of migrating over to chart.js 4.4.1 and in the prior version (2.9.4) I was able to fill the gap with a color as in the attached image.

2.9.4 sample img

In the newest version, I’m able to get close by using an opacity, but it’s not quite the same:
4.4.1 sample img

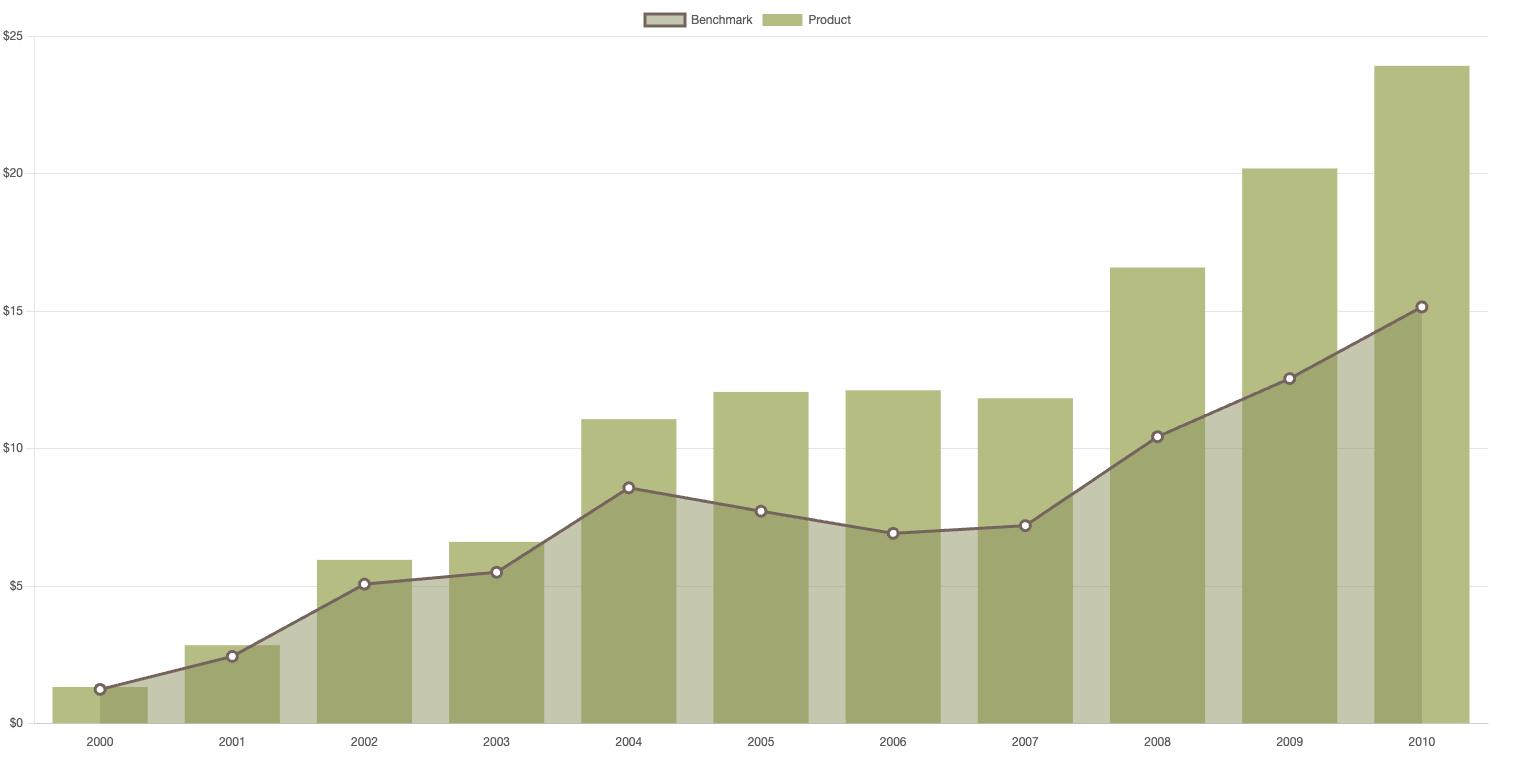
Any ideas on how to make that happen? I’m using the non-module JavaScript chartjs file.

See my test code below.

<canvas id="my-chart"></canvas>


    <script src="https://cdnjs.cloudflare.com/ajax/libs/Chart.js/4.4.1/chart.umd.js"></script>
    <script>
        
        let labels = [];
        for (let year=2000; year <= 2010; year++) {
            labels.push(year);
        }

        const config = {
            data: {
                labels: labels,
                datasets: [
                    {
                        type: "bar",
                        label: "Product",
                        data: [1331320,2851137,5952127,6607851,11068289,12059067,12117998,11827962,16582836,20184478,23915606],
                        backgroundColor: "#bec38f",
                        order: 1
                    },
                    {
                        backgroundColor: "rgba(151,156,106,0.5)",// "#979c6a",
                        borderColor: "#826f68",
                        borderWidth: 3,
                        data: [1242306,2442693,5070218,5502960,8572948,7722718,6916448,7196356,10429229,12544283,15149568],
                        label: "Benchmark",
                        type: "line",
                        fill: true,
                        pointBackgroundColor: "#ffffff",
                        pointRadius: 5,
                        order: 0
                    }
                ]
            },
            options: {
                scales: {
                    x: {
                        grid: {
                            display: false
                        }
                    },
                    y: {
                        stacked: true,
                        scaleLabel: {
                            display: false
                        },
                        ticks: {
                            callback: function(value, index, ticks) {
                                return ("$" + (value/1000000));
                            }
                        }
                    }
                },
                plugins: {
                    tooltip: {
                        intersect: true,
                        callbacks: {
                            label: function(context) {
                                return ("$" + context.parsed.y.toString().replace(/B(?=(d{3})+(?!d))/g, ","));
                            }
                        }
                    }
                }
            }
        };

        new Chart(document.getElementById("my-chart"), config);

    </script>

2

Answers


  1. I think the behaviour of 2.9.4 was erronous, to draw the fill at the bottom and the line on top?

    The only way I can think of to replicate that result, is to duplicate the
    line dataset, that is to have one instance of the dataset for the fill on the first level (order = 0) and another instance of the same dataset for the line and points on top, (order = 2). This can can be done without duplicating the actual dataset object literal, in an update to the chart:

    const chart = new Chart(document.getElementById("my-chart"), config);
    const dataset1 = chart.data.datasets[1];
    chart.data.datasets.push({
        ...dataset1,
        data: [...dataset1.data],
        label: '', // we'll disable the legend and tooltip for datasets with empty labels
        order: 2,
        fill: true
    }) 
    chart.update();
    

    That has to be accompanied by some code to exclude the duplicate dataset
    from the tooltip and legend; we’ll identify this dataset by its empty label. Also, the stacked behaviour of the y axis has to be disabled. Here’s a full snippet:

    let labels = [];
    for (let year=2000; year <= 2010; year++) {
        labels.push(year);
    }
    
    const config = {
        data: {
            labels: labels,
            datasets: [
                {
                    type: "bar",
                    label: "Product",
                    data: [1331320,2851137,5952127,6607851,11068289,12059067,12117998,11827962,16582836,20184478,23915606],
                    backgroundColor: "#bec38f",
                    order: 1
                },
                {
                    backgroundColor: "#979c6a", //"rgba(151,156,106,0.5)",// "#979c6a",
                    borderColor: "#826f68",
                    borderWidth: 3,
                    data: [1242306,2442693,5070218,5502960,8572948,7722718,6916448,7196356,10429229,12544283,15149568],
                    label: "Benchmark",
                    type: "line",
                    fill: false,
                    drawActiveElementsOnTop: true,
                    pointBackgroundColor: "#ffffff",
                    pointRadius: 5,
                    order: 0
                }
    
            ]
        },
        options: {
            scales: {
                x: {
                    grid: {
                        display: false
                    }
                },
                y: {
                    stacked: false,
                    scaleLabel: {
                        display: false
                    },
                    ticks: {
                        callback: function(value, index, ticks) {
                            return ("$" + (value/1000000));
                        }
                    }
                }
            },
            plugins: {
                tooltip: {
                    intersect: true,
                    callbacks: {
                        label: function(context) {
                            if(!context.dataset.label){
                                return null
                            }
                            return ("$" + context.parsed.y.toString().replace(/B(?=(d{3})+(?!d))/g, ","));
                        }
                    }
                },
                legend:{
                    labels: {
                        filter({text}){
                            return !!text
                        }
                    }
                }
            }
        }
    };
    
    const chart = new Chart(document.getElementById("my-chart"), config);
    const dataset1 = chart.data.datasets[1];
    chart.data.datasets.push({
        ...dataset1,
        data: [...dataset1.data],
        label: '',
        order: 2,
        fill: true,
    })
    chart.update();
    <canvas id="my-chart"></canvas>
    
    <script src="https://cdnjs.cloudflare.com/ajax/libs/Chart.js/4.4.1/chart.umd.js"></script>
    Login or Signup to reply.
  2. You can set the drawTime of the filler plugin to beforeDatasetsDraw by adding the following config to the plugins section of the config object:

    filler: {
      drawTime: 'beforeDatasetsDraw'
    },
    

    Live example:

    let labels = [];
    for (let year = 2000; year <= 2010; year++) {
      labels.push(year);
    }
    
    const config = {
      data: {
        labels: labels,
        datasets: [{
            type: "bar",
            label: "Product",
            data: [1331320, 2851137, 5952127, 6607851, 11068289, 12059067, 12117998, 11827962, 16582836, 20184478, 23915606],
            backgroundColor: "#bec38f",
            order: 1
          },
          {
            backgroundColor: "#979c6a",
            borderColor: "#826f68",
            borderWidth: 3,
            data: [1242306, 2442693, 5070218, 5502960, 8572948, 7722718, 6916448, 7196356, 10429229, 12544283, 15149568],
            label: "Benchmark",
            type: "line",
            fill: true,
            pointBackgroundColor: "#ffffff",
            pointRadius: 5,
            order: 0
          }
        ]
      },
      options: {
        scales: {
          x: {
            grid: {
              display: false
            }
          },
          y: {
            stacked: true,
            scaleLabel: {
              display: false
            },
            ticks: {
              callback: function(value, index, ticks) {
                return ("$" + (value / 1000000));
              }
            }
          }
        },
        plugins: {
          filler: {
            drawTime: 'beforeDatasetsDraw'
          },
          tooltip: {
            intersect: true,
            callbacks: {
              label: function(context) {
                return ("$" + context.parsed.y.toString().replace(/B(?=(d{3})+(?!d))/g, ","));
              }
            }
          }
        }
      }
    };
    
    new Chart(document.getElementById("my-chart"), config);
    <canvas id="my-chart"></canvas>
    <script src="https://cdnjs.cloudflare.com/ajax/libs/Chart.js/4.4.1/chart.umd.js"></script>

    Documentation

    Login or Signup to reply.
Please signup or login to give your own answer.
Back To Top
Search