skip to Main Content

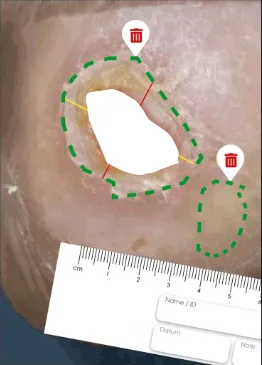
I want to render polygon shapes in d3.js – but on the edge of each polygon provide a trash icon so the polygon itself can be removed.

Then keep a track of remaining polygons.

  1. how do you append circles/trash icons to the edge of polygon boundaries – near the top of the shape?
  2. how do you make/render trash icons – a png image or another svg shape that gets attached

enter image description here

http://jsfiddle.net/o9t6ardh/

<script src="https://ajax.googleapis.com/ajax/libs/jquery/2.2.0/jquery.min.js"></script>
<script src="http://d3js.org/d3.v3.min.js" charset="utf-8"></script>

<script>
  $(document).ready(function() {

    var vis = d3.select("body").append("svg")
      .attr("width", 1000)
      .attr("height", 667);

    var scaleX = d3.scale.linear()
      .domain([-30, 30])
      .range([0, 600]);

    var scaleY = d3.scale.linear()
      .domain([0, 50])
      .range([500, 0]);

    var data = [{
        "code": "BR23",
        "points": "405,100.5625,331,108.5625,300,120.5625,290,141.5625,283,158.5625,278,171.5625,289,209.5625,304,231.5625,332,255.5625,351,264.5625,383,268.5625,400,266.5625,440,266.5625,462,266.5625,510,257.5625,522,230.5625,530,210.5625,534,183.5625,524,163.5625,512,148.5625,490,134.5625,462,124.5625"
      },
      {
        "code": "FR23",
        "points": "702,164.5625,594,250.5625,689,324.5625,749,261.5625,770,206.5625"
      }
    ];

    vis.selectAll("polygon")
      .data(data)
      .enter().append("polygon")
      .attr("points", function(d, i) {
        return d.points
      })
      .attr("fill", "transparent")
      .attr("stroke", "red")
      .attr("stroke-width", 2)
      .style("stroke-dasharray", ("15, 15")) // <== This line here!!
      .on("click", function(d, i) {
        console.log("d", d);
        d3.select(this).style("fill", "blue");
      });


    vis.append('circle')
      .attr('cx', 110)
      .attr('cy', 110)
      .attr('r', 20)
      .attr('stroke', 'black')
      .attr('fill', '#69a3b2')
      .on("click", function(d, i) {
        console.log("d", d);
      });


  });
</script>

do you need to work out boundaries of the shapes?

How to align points on the outer edges of polygon for thicker border in svg?

2

Answers


  1. Remove the first two scripts and use document.querySelectorAll, then it works.

    Login or Signup to reply.
  2. Approach 1: Get polygon bounding box

    As already mentioned, you need to calculate the bounding box coordinates for each polygon in your data set.

    It’s probably more convenient to add these coordinates directly to your data array – so you can use this data within your D3 function chain for positioning.

    Here’s a simple helper function:

    function getDataBounds(data) {
        data.forEach((item, i) => {
          let coords = item.points.split(",").map((val) => {
            return +val;
          });
          let xAll = coords.filter((coord, i) => i % 2 === 0);
          let yAll = coords.filter((coord, i) => i % 2 !== 0);
          let xMin = Math.min(...xAll);
          let xMax = Math.max(...xAll);
          let yMin = Math.min(...yAll);
          let yMax = Math.max(...yAll);
          let bb = {
            x: xMin,
            y: yMin,
            cx: xMin + (xMax - xMin) / 2,
            cy: yMin + (yMax - yMin) / 2,
            top: yMin,
            bottom: yMax,
            right: xMax,
            left: xMin,
            width: xMax - xMin,
            height: yMax - yMin
          };
          data[i].bb = bb;
        });
        return data;
      }
    

    It loops through all polygon points and calculates the bounding box according to x and y extrema.

    The centroid coordinates would be:

        cx: xMin + (xMax - xMin) / 2,
        cy: yMin + (yMax - yMin) / 2,  
    

    If your polygons are already appended to the DOM, you could also use getBBox().

    Create trash button icon

    I’d recommend to design an icon in an editor like inkscape including a background circle. This way you don’t need to append multiple elements (imho, selecting parent nodes in d3 can be a bit "unintuitive" …).

    body{
      background:#ccc;
    }
    
    svg{
      color:red
    }
    <h3>Icon Design</h3>
    <svg  viewBox="0 0 640 720" width="40" height="40">
      <circle cx="50%" cy="50%" r="50%" fill="white"/>
      <path d="M152.6 576v-378h-24.6v-36h112.8v-18h158.4v18h112.8v36h-24.6v378h-334.8zm36-36h262.8v-342h-262.8v342zm63.6-51.6h36v-239.4h-36v239.4zm99.6 0h36v-239.4h-36v239.4zm-163.2-290.4v342v-342z" fill="currentColor"/>
    </svg>
    
    
    <h3>Reusable Icon asset</h3>
    <svg width="40" height="40">><use href="#icnTrash"/></svg>
    <svg width="40" height="40">><use href="#icnTrash" style="color:green"/></svg>
    
    <!-- hidden icon asset -->
    <svg style="width:0; height:0">
      <symbol id="icnTrash" viewBox="0 0 640 720">
        <circle cx="50%" cy="50%" r="50%" fill="white" />
        <path d="M152.6 576v-378h-24.6v-36h112.8v-18h158.4v18h112.8v36h-24.6v378h-334.8zm36-36h262.8v-342h-262.8v342zm63.6-51.6h36v-239.4h-36v239.4zm99.6 0h36v-239.4h-36v239.4zm-163.2-290.4v342v-342z" fill="currentColor" />
      </symbol>
    </svg>

    Example

    $(document).ready(function () {
      var vis = d3
        .select("body")
        .append("svg")
        .attr("width", 1000)
        .attr("height", 667);
    
      var scaleX = d3.scale.linear().domain([-30, 30]).range([0, 600]);
      var scaleY = d3.scale.linear().domain([0, 50]).range([500, 0]);
    
      var data = [
        {
          code: "BR23",
          points:
            "405,100.5625,331,108.5625,300,120.5625,290,141.5625,283,158.5625,278,171.5625,289,209.5625,304,231.5625,332,255.5625,351,264.5625,383,268.5625,400,266.5625,440,266.5625,462,266.5625,510,257.5625,522,230.5625,530,210.5625,534,183.5625,524,163.5625,512,148.5625,490,134.5625,462,124.5625"
        },
        {
          code: "FR23",
          points: "702,164.5625,594,250.5625,689,324.5625,749,261.5625,770,206.5625"
        }
      ];
    
      /**
       * calculate bounds for polygons
       *
       */
      function getDataBounds(data) {
        data.forEach((item, i) => {
          let coords = item.points.split(",").map((val) => {
            return +val;
          });
          let xAll = coords.filter((coord, i) => i % 2 === 0);
          let yAll = coords.filter((coord, i) => i % 2 !== 0);
          let xMin = Math.min(...xAll);
          let xMax = Math.max(...xAll);
          let yMin = Math.min(...yAll);
          let yMax = Math.max(...yAll);
          let bb = {
            x: xMin,
            y: yMin,
            cx: xMin + (xMax - xMin) / 2,
            cy: yMin + (yMax - yMin) / 2,
            top: yMin,
            bottom: yMax,
            right: xMax,
            left: xMin,
            width: xMax - xMin,
            height: yMax - yMin
          };
          data[i].bb = bb;
        });
        return data;
      }
    
      // add boundaries to data array
      data = getDataBounds(data);
      let iconWidth = 40;
      let iconHeight = 40;
    
      vis
        .selectAll("polygon")
        .data(data)
        .enter()
        .append("polygon")
        .attr("id", (d, i) => {
          return "polygon" + d.code;
        })
        .attr("points", function (d, i) {
          return d.points;
        })
        .attr("fill", "transparent")
        .attr("stroke", "red")
        .attr("stroke-width", 2)
        .style("stroke-dasharray", "15, 15") // <== This line here!!
        .on("click", function (d, i) {
          d3.select(this).node().classList.toggle("selected");
          //let btn = document.getElementById("btnPoly-" + d.code);
          //btn.classList.toggle("hidden");
        });
    
      // add circles
      vis
        .selectAll("use")
        .data(data)
        .enter()
        .append("use")
        .attr("class", "btnTrash")
        .attr("id", function (d, i) {
          return "btnPoly-" + d.code;
        })
        .attr("width", iconWidth)
        .attr("height", iconHeight)
        .attr("href", "#icnTrash")
        .attr("x", function (d, i) {
          return d.bb.cx - iconWidth / 2;
        })
        .attr("y", function (d, i) {
          return d.bb.top - iconHeight / 2 - 20;
        })
        .on("click", (d, i) => {
          let poly = document.getElementById("polygon" + d.code);
          let btnTrash = document.getElementById("btnPoly-" + d.code);
          btnTrash.remove();
          poly.remove();
        });
    });
    body{
      background:#ccc;
    }
    
    .btnTrash{
      color:red
    }
    
    .hidden{
      opacity:0
    }
    
    .selected{
      stroke: green
    }
    <script src="https://ajax.googleapis.com/ajax/libs/jquery/2.2.0/jquery.min.js"></script>
    <script src="http://d3js.org/d3.v3.min.js" charset="utf-8"></script>
    
    <!-- hidden icon asset -->
    <svg style="width:0; height:0">
      <symbol id="icnTrash" viewBox="0 0 640 720">
        <circle cx="50%" cy="50%" r="50%" fill="white" />
        <path d="M152.6 576v-378h-24.6v-36h112.8v-18h158.4v18h112.8v36h-24.6v378h-334.8zm36-36h262.8v-342h-262.8v342zm63.6-51.6h36v-239.4h-36v239.4zm99.6 0h36v-239.4h-36v239.4zm-163.2-290.4v342v-342z" fill="currentColor" />
      </symbol>
    </svg>

    Approach 2: get topmost point on polygon outline

    Similar to the first approach, we’re updating the initial data object.
    This time we’re searching the top most point on the polygon’s outline.

    We get this point by comparing the y values of each polygon vertice.

      function getTopMostPoint(data) {
        data.forEach((item, i) => {
          let points = item.points.split(',');
          let topY = 999999;
          let pTop = {}
          for(let p=0; p<points.length; p+=2){
            let pt = {x:+points[p], y:+points[p+1]}
            if(pt.y<topY){
              pTop = pt;
              topY = pt.y;
            }
          }
          data[i].anchor = {
            x: pTop.x,
            y: pTop.y
          };
         
        });
        return data;
      }
    
      
      var data = [
        {
          code: "BR23",
          points:
            "405,100.5625,331,108.5625,300,120.5625,290,141.5625,283,158.5625,278,171.5625,289,209.5625,304,231.5625,332,255.5625,351,264.5625,383,268.5625,400,266.5625,440,266.5625,462,266.5625,510,257.5625,522,230.5625,530,210.5625,534,183.5625,524,163.5625,512,148.5625,490,134.5625,462,124.5625"
        },
        {
          code: "FR23",
          points: "702,164.5625,594,250.5625,689,324.5625,749,261.5625,770,206.5625"
        }
      ];
    
    /**
       * calculate anchor for polygons
       * find topmost point on polygon outline
       *
       */
      function getTopMostPoint(data) {
        data.forEach((item, i) => {
          let points = item.points.split(',');
          let topY = 999999;
          let pTop = {}
          for(let p=0; p<points.length; p+=2){
            let pt = {x:+points[p], y:+points[p+1]}
            if(pt.y<topY){
              pTop = pt;
              topY = pt.y;
            }
          }
          data[i].anchor = {
            x: pTop.x,
            y: pTop.y
          };
         
        });
        return data;
      }


    $(document).ready(function () {
      var vis = d3
        .select("body")
        .append("svg")
        .attr("width", 1000)
        .attr("height", 667);
    
      var scaleX = d3.scale.linear().domain([-30, 30]).range([0, 600]);
      var scaleY = d3.scale.linear().domain([0, 50]).range([500, 0]);
    
      // get topmost point
      data = getTopMostPoint(data);
    
      let iconWidth = 40;
      let iconHeight = 40;
    
      vis
        .selectAll("polygon")
        .data(data)
        .enter()
        .append("polygon")
        .attr("id", (d, i) => {
          return "polygon" + d.code;
        })
        .attr("points", function (d, i) {
          return d.points;
        })
        .attr("fill", "transparent")
        .attr("stroke", "red")
        .attr("stroke-width", 2)
        .style("stroke-dasharray", "15, 15") // <== This line here!!
        .on("click", function (d, i) {
          d3.select(this).node().classList.toggle("selected");
          //let btn = document.getElementById("btnPoly-" + d.code);
          //btn.classList.toggle("hidden");
        });
    
      // add circles
      vis
        .selectAll("use")
        .data(data)
        .enter()
        .append("use")
        .attr("class", "btnTrash")
        .attr("id", function (d, i) {
          return "btnPoly-" + d.code;
        })
        .attr("width", iconWidth)
        .attr("height", iconHeight)
        .attr("href", "#icnTrash")
        .attr("x", function (d, i) {
          return d.anchor.x - iconWidth / 2;
        })
        .attr("y", function (d, i) {
          return d.anchor.y - iconHeight / 2 - 20;
        })
        .on("click", (d, i) => {
          let poly = document.getElementById("polygon" + d.code);
          let btnTrash = document.getElementById("btnPoly-" + d.code);
          btnTrash.remove();
          poly.remove();
        });
    });
    body{
      background:#ccc;
    }
    
    .btnTrash{
      color:red
    }
    
    .selected{
      stroke: green
    }
    <script src="https://ajax.googleapis.com/ajax/libs/jquery/2.2.0/jquery.min.js"></script>
    <script src="http://d3js.org/d3.v3.min.js" charset="utf-8"></script>
    
    <!-- hidden icon asset -->
    <svg style="width:0; height:0">
      <symbol id="icnTrash" viewBox="0 0 640 720">
        <circle cx="50%" cy="50%" r="50%" fill="white" />
        <path d="M152.6 576v-378h-24.6v-36h112.8v-18h158.4v18h112.8v36h-24.6v378h-334.8zm36-36h262.8v-342h-262.8v342zm63.6-51.6h36v-239.4h-36v239.4zm99.6 0h36v-239.4h-36v239.4zm-163.2-290.4v342v-342z" fill="currentColor" />
      </symbol>
    </svg>
    Login or Signup to reply.
Please signup or login to give your own answer.
Back To Top
Search