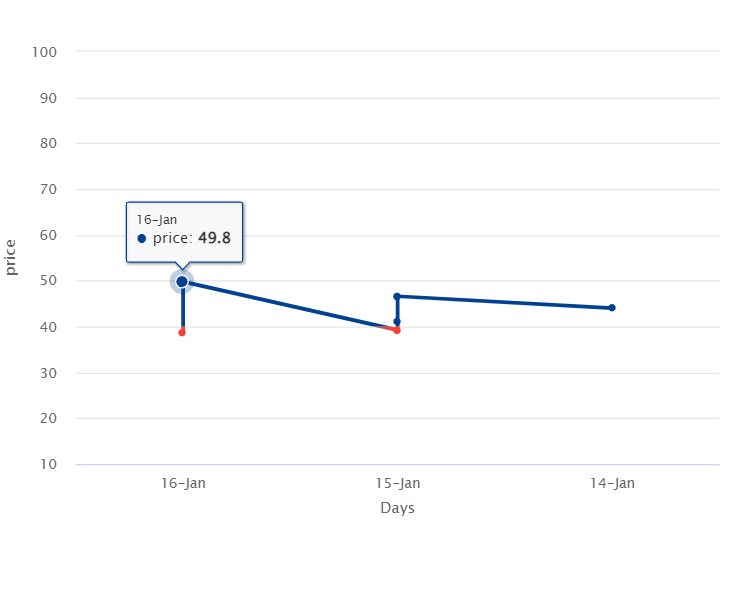
Passing the values to y-axis series like below:
this.chartOptions = {
  series: [
    {
      type: 'line',
      data: [
            [0,38.6],
            [0,49.8],
            [1,39.2],
            [1,41.1],
            [1,46.6],
            [2,44]
        ],
      color: '#004191',
      showInLegend: false,
      name: 'price',
      threshold: 40,
      negativeColor: '#F34336',
      marker: {
        enabled: true,
        radius: 3,
        symbol: 'circle',
      },
    },
  ],
  title: {
    text: '',
  },
  xAxis: {
    title: {
      text: 'Days',
    },
    categories: ["16-Jan", "15-Jan", "14-Jan"],
  },
  yAxis: {
    title: {
      text: 'price',
    },
    gridLineWidth: 1,
    min: 10,
    max: 100,
    tickPixelInterval: 35,
  },
  exporting: {
    enabled: false,
    showTable: false,
    buttons: {
      contextButton: {
        menuItems: ['downloadPDF'],
      },
    },
  },
  credits: {
    enabled: false,
  },
};
But the issue is the multiple values are rendering in the view but the values are not displayed in the tooltip on mouse hover of particular value.
Case: When I hover on 49.8 it shows tooltip but won’t show for 38.6. Even though they belongs to 1st series of y-axis.
Soution required:
- Should display every value in the tooltip of y-axis on mouse hover.
- I need to display multiple values in the tooltip(i,e display,rtMode,initMode).
Attaching stackblitz ref

 Question posted in


2
Answers
Have multiple series
By the example I’ve seen here:
https://www.highcharts.com/forum/viewtopic.php?t=33780#:~:text=http%3A//jsfiddle.net/aykutyararbas/rry1sdhm/
you could add a new whole series with the data points you’d like to see but just make the series invisible.
OR
Show additional tooltip Data
just only show additional tooltip Data like here (Surely useful for rtMode and initMode, etc.):
https://www.highcharts.com/forum/viewtopic.php?t=48914#:~:text=https%3A//jsfiddle.net/BlackLabel/e7yuga5d/
I think the main problem is, that within HighCharts you can show multiple y-values that are on the same x-value BUT not within the same series.
I’m sorry I couldn’t find more. I hope this maybe helps.
Maybe it just doesn’t work, and HighCharts wants you to only see one point:
https://www.highcharts.com/forum/viewtopic.php?t=43897#:~:text=https%3A//jsfiddle.net/BlackLabel/ktwfopdn/
This is possible to achive by following steps:
First, instead of the line series, use scatter type. Set
lineWidth: 2just to simulate line series.Next, adjust the tooltip via
headerFormat(to use identical as original line series) and more advancedpointFormatter:Demo:
https://jsfiddle.net/BlackLabel/ts7bcjwo/
API Reference:
https://api.highcharts.com/highcharts/tooltip.pointFormatter