


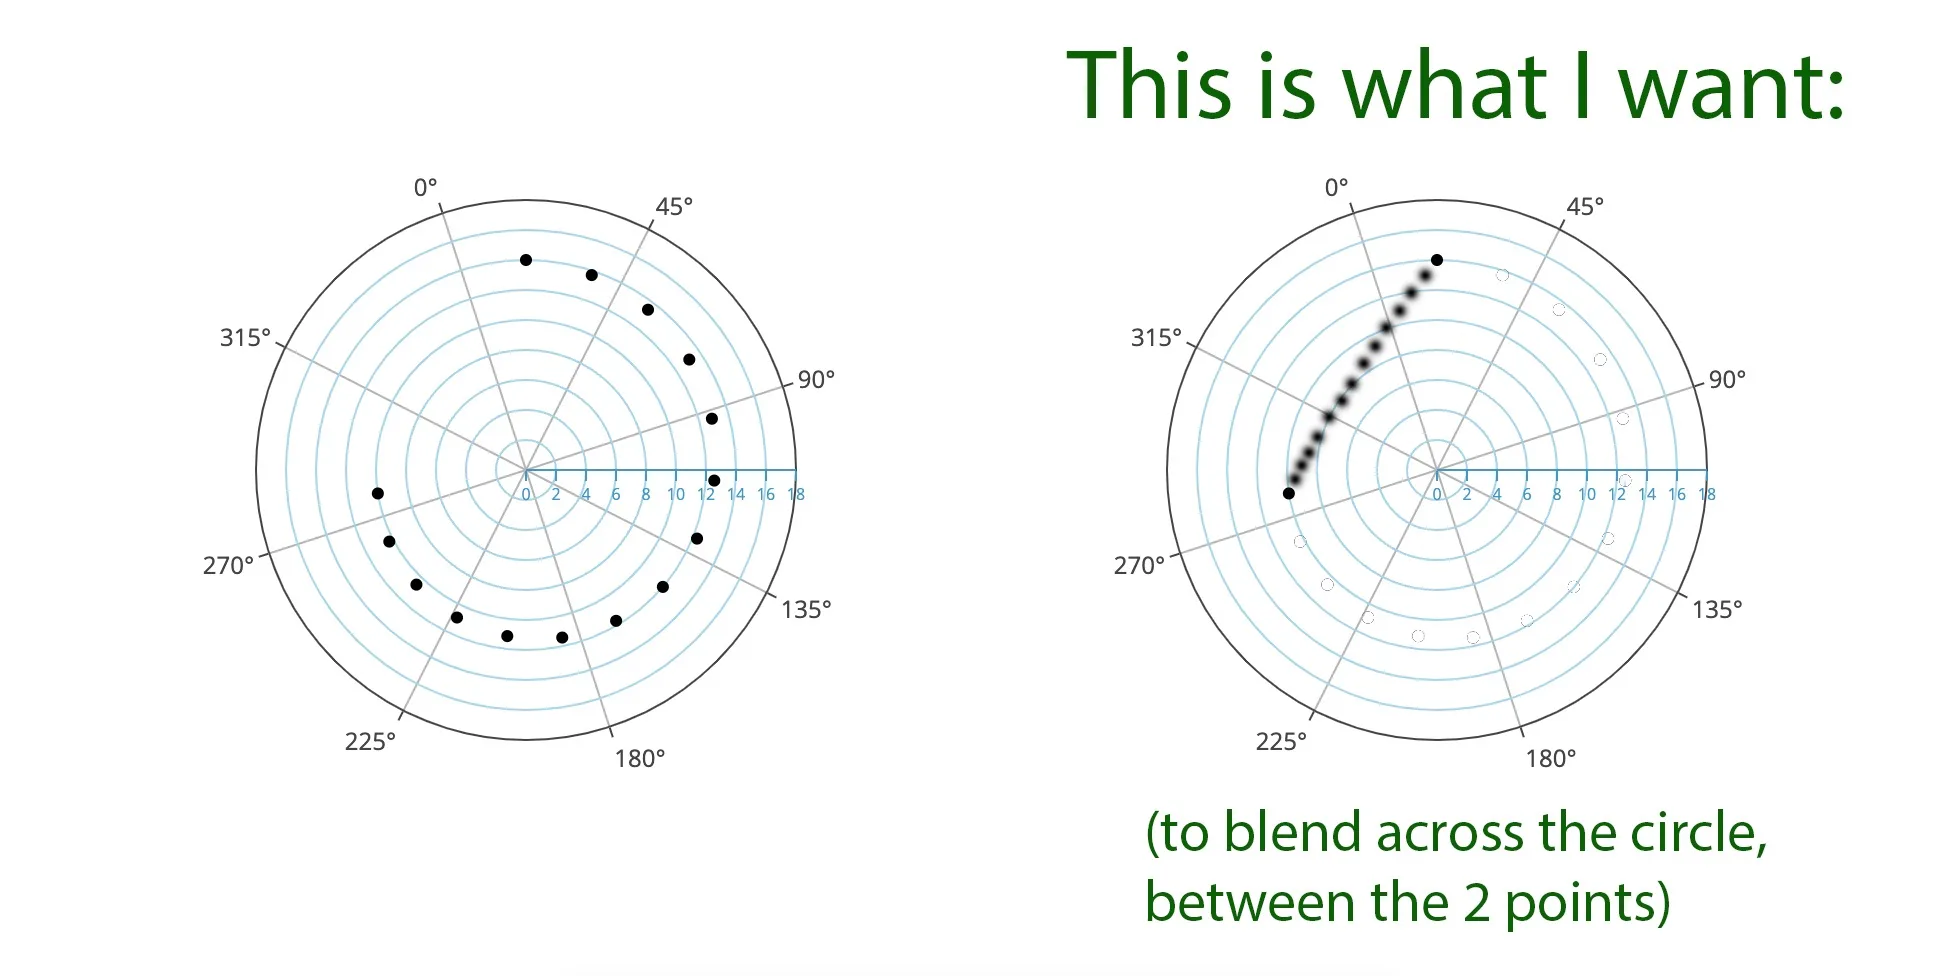
I’m trying to plot a specified number of steps between 2 points on a polar circle graph. The angle (radius) is represented by HUE, from 0 to 360. The theta is represented by CHROMA (strength).
I specify how many steps I want and blend these 2 independent values, but the result is not what I expect, the points go around the circle, where-as I want it to go across (see screenshot).
I’m not very strong in geometry, any help would be much appreciated!
<!doctype html>
<html lang="en">

<head>
    <title>Colour Chart</title>
</head>

<body>
    <div id="chartContainer1"></div>

    <script src="https://cdn.plot.ly/plotly-2.27.0.min.js" charset="utf-8"></script>

    <script>

        const pigments = [{
            key: "A",
            name: "Red",
            hue: 18,
            chroma: 14,
        },
        {
            key: "B",
            name: "Blue",
            hue: 279,
            chroma: 10,
        }
        ];

        function getNumberBlend(min, max, totalSteps) {
            let steps = new Array(totalSteps);
            let distance = max - min;
            for (i = 0; i < totalSteps; i++) {
                steps[i] = min + distance * (i / (totalSteps - 1));
            }
            return steps;
        }


        // Define properties
        let radiusData = new Array();
        let thetaData = new Array();
        let textData = new Array();
        let totalSteps = 15;

        // Plot blends from each pigment to the next
        let chromaBlend = getNumberBlend(pigments[0]["chroma"], pigments[1]["chroma"], totalSteps);
        let hueBlend = getNumberBlend(pigments[0]["hue"], pigments[1]["hue"], totalSteps);

        for (let i = 0; i < totalSteps; i++) {
            radiusData.push(chromaBlend[i]);
            thetaData.push(hueBlend[i]);
            textData.push("");
        }

        let plotlyData = [
            {
                type: "scatterpolar",
                mode: "markers+text",
                r: radiusData,
                theta: thetaData,
                text: textData,
                marker: {
                    color: "#000000"
                },
                subplot: "polar"
            }
        ]

        let plotlyLayout = {
            polar: {
                radialaxis: {
                    range: [0, 18],
                    tickfont: {
                        size: 8
                    },
                    color: "rgb(0,153,204)",
                },
                angularaxis: {
                    rotation: 108, // Start with 5R at North
                    direction: "clockwise",
                }
            }
        }


        Plotly.newPlot("chartContainer1", plotlyData, plotlyLayout)

    </script>

</body>
</html>
I tried to blend between the different values, but I can’t seem to figure out the way to correctly do this calculation.
2
Answers
You want points along a straight line between your two points, but you are using a polar co-ordinate system ( angle and radius ). IOt is a difficult task, UNLESS you convert to use cartesian co-ordinates ( x and y ).
So I would sugest:
From a geometry standpoint, getNumberBlend is saying "add some to the angle, add some to the radius," so the output is what I’d expect from that. Since the points you want are on a line, it’ll be more complicated because lines are harder in polar coordinates. I think something like this will work though.
I noticed you said radius is represented by HUE (0-360). That’s an angle. I think you mean theta is represented by hue, and radius is represented by chroma.
I’ve thought about it and the easiest way would be if you could possibly write the entire graph in cartesian coordinates. Then you could use this method. The first answer is not too complicated and works well.
If you can’t do the entire program in cartesian, then you could convert your two points into cartesian, use the method above to generate the points needed, then convert those to polar coordinates and plot. Or, if it’s possible to plot cartesian and polar on the same plot, no need to convert them back.
Converting to cartesian in JS (Scroll down, JS near bottom)
Converting to polar in JS
The issue with attempting to find a point at a distance along a line in polar format is that you’ll notice, radius does not change uniformly in increments. It starts at 8, gets smaller, then increases again. In cartesian coordinates, x and y uniformly increase or decrease along a line.
Also, I tried converting your points to cartesian and plotting a line. It turns out similar to your desired line but not the same… I haven’t messed much with JS before, but on first glance I’m wondering if it’s the fact you told the plot to go clockwise about the axis. Normally, degrees and radians are measured counter-clockwise from the x-axis, so saying clockwise might have it go the wrong way and end up in the wrong quadrant.