Is it possible to to have more control on hierarchy of the Organization Chart on Google Charts?
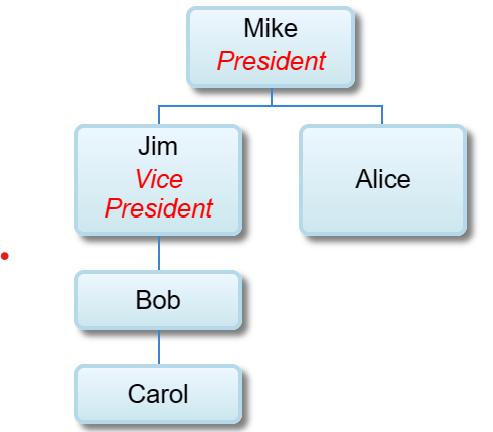
Illustration:
on website developers.google.com for the below example:
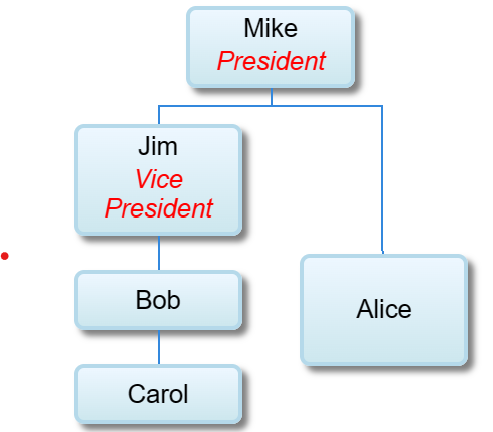
can Alice be placed vertically down to Bob’s side (level) as below:
Here is the example code
<html>
  <head>
    <script type="text/javascript" src="https://www.gstatic.com/charts/loader.js"></script>
    <script type="text/javascript">
      google.charts.load('current', {packages:["orgchart"]});
      google.charts.setOnLoadCallback(drawChart);

      function drawChart() {
        var data = new google.visualization.DataTable();
        data.addColumn('string', 'Name');
        data.addColumn('string', 'Manager');
        data.addColumn('string', 'ToolTip');

        // For each orgchart box, provide the name, manager, and tooltip to show.
        data.addRows([
          [{'v':'Mike', 'f':'Mike<div style="color:red; font-style:italic">President</div>'},
           '', 'The President'],
          [{'v':'Jim', 'f':'Jim<div style="color:red; font-style:italic">Vice President</div>'},
           'Mike', 'VP'],
          ['Alice', 'Mike', ''],
          ['Bob', 'Jim', 'Bob Sponge'],
          ['Carol', 'Bob', '']
        ]);

        // Create the chart.
        var chart = new google.visualization.OrgChart(document.getElementById('chart_div'));
        // Draw the chart, setting the allowHtml option to true for the tooltips.
        chart.draw(data, {'allowHtml':true});
      }
   </script>
    </head>
  <body>
    <div id="chart_div"></div>
  </body>
</html>


2
Answers
It looks like Google Charts’ Organization Chart does not provide an API to manually control the exact placement of individual nodes within the hierarchy. The layout and placement are handled automatically based on the defined relationships.
You can control the style and content within each node, but the specific requirement to place Alice vertically down to Bob’s side while being a direct report of Mike cannot be directly implemented using the standard OrgChart options. If such control over placement is crucial, you may need to look for a third-party library that offers more flexibility or consider implementing a custom solution.
Here’s a hack to do it. Create a node where you basically hide everything except for the left border and position it so it lines up with the rest of the chart’s lines.
The unique node IDs should begin with "__hideme", so that these can be detected and hidden, except for the left border.
So instead of this node,
Create a hidden node and place it between Mike and Alice, like this:
This is the entire code: