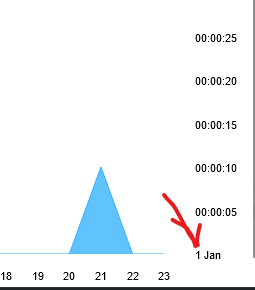
Why highcharts yAxis type datetime start from 1 jan always?
I need to show only time there but first value is always 1 jan. How to change this to start from 00:00 or 00:00:00 or just 0 whatever? If i remove datetime from yAxis in that case i have just value from data which is not what i need because i need to show averange time in chart as you can see on example belowe
Here is demo
function seconds2timeRich(d) {
    d = Number(d);
    var h = Math.floor(d / 3600);
    var m = Math.floor(d % 3600 / 60);
    var s = Math.floor(d % 3600 % 60);

    var hDisplay = h > 0 ? h + (h == 1 ? "h, " : "h ") : "";
    var mDisplay = m > 0 ? m + (m == 1 ? "m, " : "m ") : "";
    var sDisplay = s > 0 ? s + (s == 1 ? "s" : "s") : "0s";

        return hDisplay + mDisplay + sDisplay;

}

var options = {
            chart: {
                height:200,
                animation: true
            },
            title: {
                text: null,
            },
            global : {
                useUTC : false
            },
            tooltip: {
                outside: true,
                shared: true,
                formatter: function() {
                    var h = '0'+this.x;
                     return '<b>'+h.slice(-2)+' h</b><br>Avg. time on site on  '+seconds2timeRich(this.point.y/1000);

                }

            },
            xAxis: [{
                 minorTickLength: 0,
                 tickLength: 0,
                 labels: {
                    style: {
                        color: 'var(--trock-gray-400)',
                        fontSize:'0.6944444444rem',
                        fontWeight: '500',
                    }
                },
                lineWidth: 0,
                visible:true,
                type: 'category',
                crosshair: {
                    width:2,
                    color: "rgba(58, 125, 238, 0.1)"
                },
            }],
            yAxis: {
               type: 'datetime',
                softMin: 0,
                softMax: 1,
                min:0,
                minTickInterval:1,
                gridLineColor: 'var(--trock-gray-200)',
                labels: {
                    style: {
                        color: 'var(--trock-gray-400)',
                        fontSize:'0.6944444444rem',
                        fontWeight: '500'
                    }
                },
                opposite: true,
                title: null,
            },
            accessibility: {enabled: false},
            legend:false,
            credits:false,
            plotOptions: {
                area: {
                    stacking: 'normal',
                    marker: {
                        radius: 0,
                    },
                    lineWidth: 1,
                    states: {
                        hover: {
                            lineWidth: 1
                        }
                    },
                    threshold: null
                }
            },
            series: [
                {
                    type: 'area',
                    data: [["00",0],["01",20000],["02",0],["03",0],["04",0],["05",0],["06",0],["07",0],["08",0],["09",0],["10",0],["11",26548],["12",0],["13",35000],["14",0],["15",0],["16",0],["17",0],["18",0],["19",0],["20",0],["21",10000],["22",0],["23",0]],

                }
            ]
        };
var AvgChart = Highcharts.chart('container',options);
<script src="https://code.highcharts.com/highcharts.js"></script>
<div id="container"></div>


2
Answers
Ok i found solution may be can help to someone with same problem, actually merge options is help
And than initialise chart
That’s because of the default settings for
dateTimeLabelFormats. The first label is treated as aday. You can use:Live demo: https://jsfiddle.net/BlackLabel/1ztf84ns/
API Reference: https://api.highcharts.com/highcharts/xAxis.dateTimeLabelFormats