skip to Main Content

I have a Chart.js the output looks like the first image, I would like it to look like the second image where the y-axis line will "cross" the bar and space it out a bit for better visibility, I don’t think we can call this padding or how can I manage to create this effect using Chart.js?

enter image description here

enter image description here

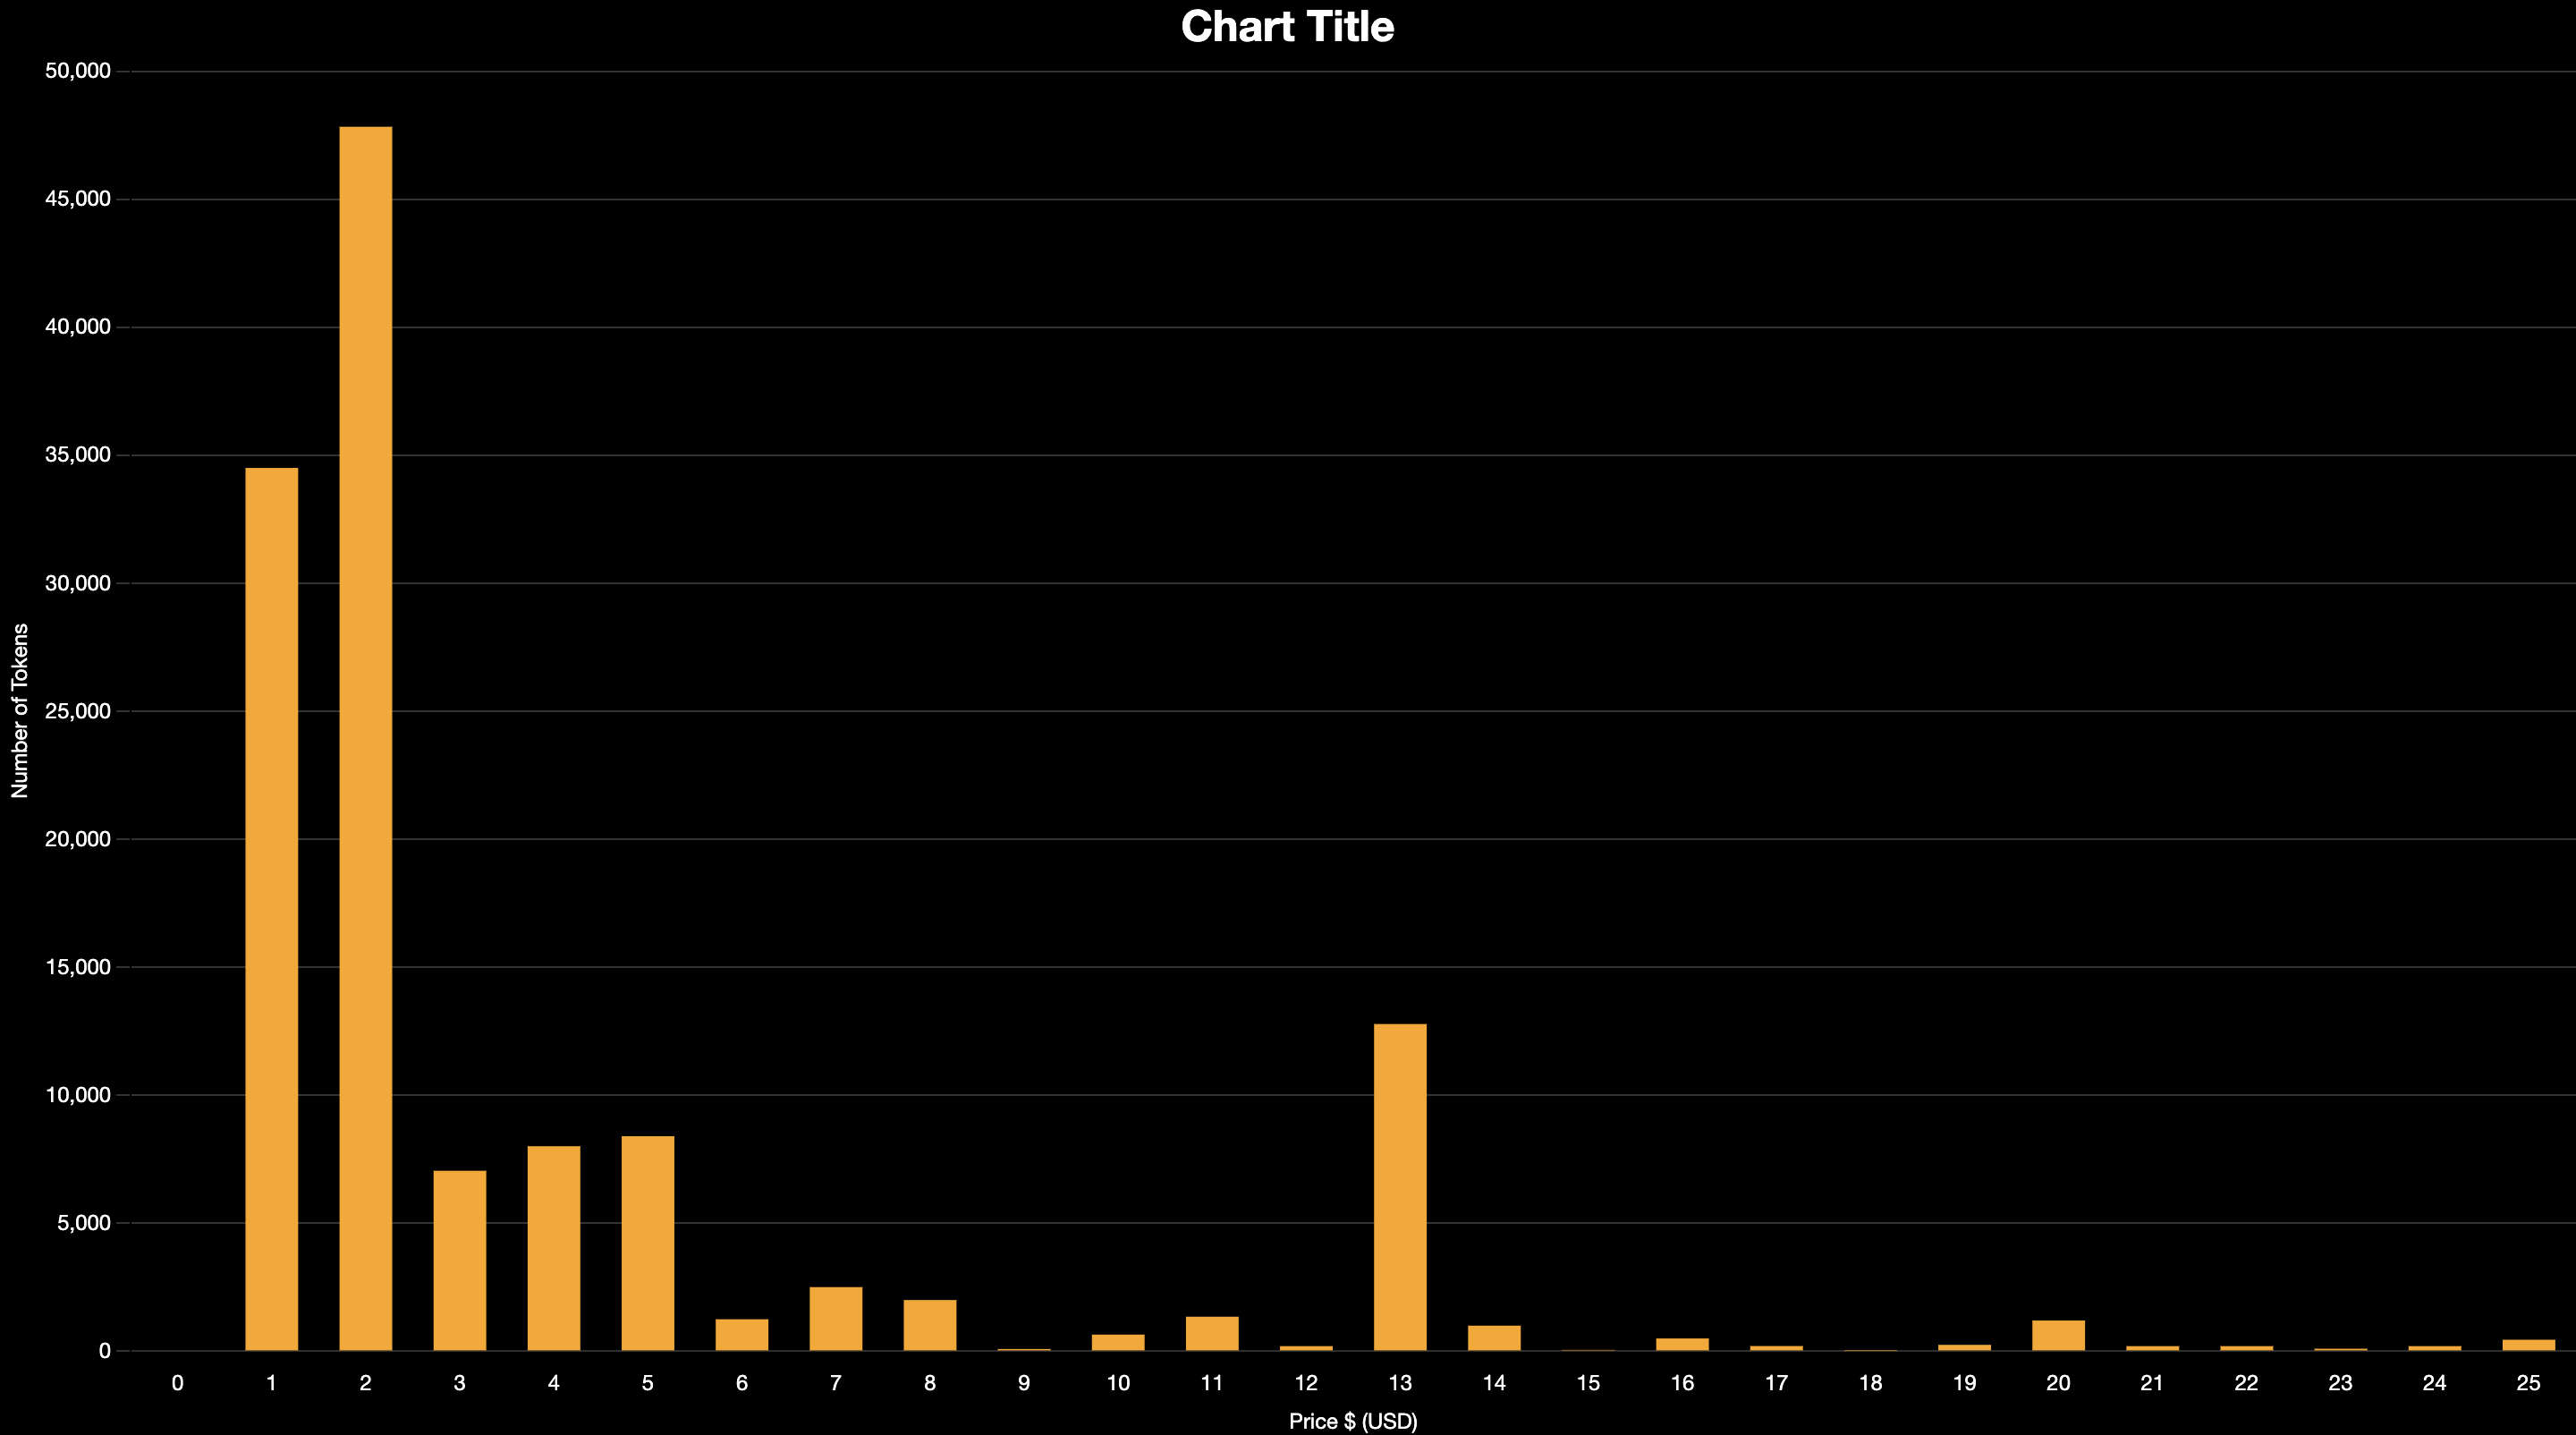
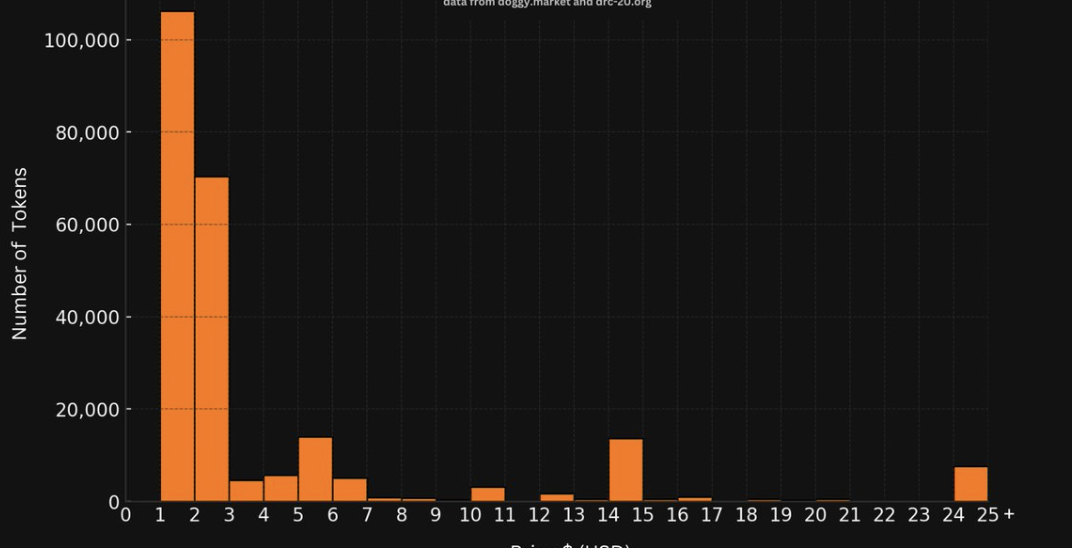
This is the code I have that creates the bars like the first image thanks ahead.

<!DOCTYPE html>
<html lang="en">

<head>
  <meta charset="UTF-8">
  <meta name="viewport" content="width=device-width, initial-scale=1.0">
  <title>$DOGI Listings Graph</title>
  <script src="https://cdn.jsdelivr.net/npm/chart.js"></script>
  <style>
    html,
    body {
      height: 100%;
      margin: 0;
      background-color: black;
      color: white;
    }
    
    canvas {
      width: 100% !important;
      height: 100% !important;
    }
  </style>
</head>

<body style="background-color: black;color: white;">

  <canvas id="myChart"></canvas>

  <script>
    const chartData = [{
        x: 1,
        y: 34504
      }, {
        x: 2,
        y: 47831
      },
      {
        x: 3,
        y: 7050
      }, {
        x: 4,
        y: 8009
      },
      {
        x: 5,
        y: 8400
      }, {
        x: 6,
        y: 1250
      },
      {
        x: 7,
        y: 2505
      }, {
        x: 8,
        y: 2001
      },
      {
        x: 9,
        y: 88
      }, {
        x: 10,
        y: 650
      },
      {
        x: 11,
        y: 1350
      }, {
        x: 12,
        y: 200
      },
      {
        x: 13,
        y: 12782
      }, {
        x: 14,
        y: 1000
      },
      {
        x: 15,
        y: 50
      }, {
        x: 16,
        y: 500
      },
      {
        x: 17,
        y: 204
      }, {
        x: 18,
        y: 15
      },
      {
        x: 19,
        y: 250
      }, {
        x: 20,
        y: 1200
      },
      {
        x: 21,
        y: 200
      }, {
        x: 22,
        y: 200
      },
      {
        x: 23,
        y: 100
      }, {
        x: 24,
        y: 200
      },
      {
        x: 25,
        y: 450
      }
    ]


    async function createGraphData() {
      const ctx = document.getElementById('myChart').getContext('2d');
      const myChart = new Chart(ctx, {
        type: 'bar',
        data: {
          datasets: [{
            label: '# of Tokens',
            data: chartData,
            backgroundColor: 'rgb(255,165,3,0.8)',
          }]
        },
        options: {
          legend: {
            display: false
          },
          scales: {
            x: {
              type: 'linear',
              position: 'bottom',
              min: 0,
              max: 25,
              ticks: {
                stepSize: 1,
                color: 'white',
                autoSkip: false,
              },

              title: {
                display: true,
                text: 'Price $ (USD)',
                color: 'white'
              }
            },
            y: {
              beginAtZero: true,
              grid: {
                color: 'rgba(255,255,255,0.1)'
              },
              title: {
                display: true,
                text: 'Number of Tokens',
                color: 'white'
              },

              ticks: {
                color: 'white'
              }
            }
          },
          plugins: {
            legend: {
              display: false,
              labels: {
                color: 'white'
              }
            },
            title: {
              display: true,
              text: 'Chart Title',
              color: 'white',
              font: {
                size: 24
              }
            }
          },
          maintainAspectRatio: false,
          responsive: true,
          barPercentage: 0.7,
          categoryPercentage: 0.8,
        }
      });
    }

    createGraphData().catch(console.error);
  </script>

</body>

</html>

2

Answers


  1. Just add z propriety to the grid of your scale in option and set it to 1 while the default is -1
    And for spacing you can add border option with dash propriety and set the spacing in array
    Here is an example with some values that might be good with your case and colors you can add them to the "y" object inside scales object :

    grid: {
        color: 'rgba(255,255,255,0.35)',
        z:1,
    },
    border:{
           dash:[3,3]
    },
    

    Also check the docs for more ChartJs styling

    <!DOCTYPE html>
    <html lang="en">
    
    <head>
        <meta charset="UTF-8">
        <meta name="viewport" content="width=device-width, initial-scale=1.0">
        <title>$DOGI Listings Graph</title>
        <script src="https://cdn.jsdelivr.net/npm/chart.js"></script>
        <style>
            html,
            body {
                height: 100%;
                margin: 0;
                background-color: black;
                color: white;
            }
    
            canvas {
                width: 100% !important;
                height: 100% !important;
            }
        </style>
    </head>
    
    <body style="background-color: black;color: white;">
    
    <canvas id="myChart"></canvas>
    
    <script>
    
        const chartData = [
            { x: 1, y: 34504 }, { x: 2, y: 47831 },
            { x: 3, y: 7050 }, { x: 4, y: 8009 },
            { x: 5, y: 8400 }, { x: 6, y: 1250 },
            { x: 7, y: 2505 }, { x: 8, y: 2001 },
            { x: 9, y: 88 }, { x: 10, y: 650 },
            { x: 11, y: 1350 }, { x: 12, y: 200 },
            { x: 13, y: 12782 }, { x: 14, y: 1000 },
            { x: 15, y: 50 }, { x: 16, y: 500 },
            { x: 17, y: 204 }, { x: 18, y: 15 },
            { x: 19, y: 250 }, { x: 20, y: 1200 },
            { x: 21, y: 200 }, { x: 22, y: 200 },
            { x: 23, y: 100 }, { x: 24, y: 200 },
            { x: 25, y: 450 }
        ]
    
    
        async function createGraphData() {
            const ctx = document.getElementById('myChart').getContext('2d');
            const myChart = new Chart(ctx, {
                type: 'bar',
                data: {
                    datasets: [{
                        label: '# of Tokens',
                        data: chartData,
                        backgroundColor: 'rgb(255,165,3,0.8)',
                    }]
                },
                options: {
                    legend: {
                        display: false
                    },
                    scales: {
                        x: {
                            type: 'linear',
                            position: 'bottom',
                            min: 0,
                            max: 25,
                            ticks: {
                                stepSize: 1,
                                color: 'white',
                                autoSkip: false,
                            },
    
                            title: {
                                display: true,
                                text: 'Price $ (USD)',
                                color: 'white'
                            }
                        },
                        y: {
                            beginAtZero: true,
                            grid: {
                                color: 'rgba(255,255,255,0.35)',
                                z:1,
                            },
                            border:{
                                dash:[3,3]
                            },
                            title: {
                                display: true,
                                text: 'Number of Tokens',
                                color: 'white'
                            },
    
                            ticks: {
                                color: 'white'
                            },
                        }
                    },
                    plugins: {
                        legend: {
                            display: false,
                            labels: {
                                color: 'white'
                            }
                        },
                        title: {
                            display: true,
                            text: 'Chart Title',
                            color: 'white',
                            font: {
                                size: 24
                            }
                        }
                    },
                    maintainAspectRatio: false,
                    responsive: true,
                    barPercentage: 0.7,
                    categoryPercentage: 0.8,
                }
            });
        }
    
        createGraphData().catch(console.error);
    
    </script>
    
    </body>
    
    </html>
    Login or Signup to reply.
  2. You can move the Y-axis grid above the bar layer with the z property. I’m not sure if this meets all your criteria, though. I’ve also adjusted color.

    https://www.chartjs.org/docs/latest/axes/styling.html

    const chartData = [{
        x: 1,
        y: 34504
      }, {
        x: 2,
        y: 47831
      },
      {
        x: 3,
        y: 7050
      }, {
        x: 4,
        y: 8009
      },
      {
        x: 5,
        y: 8400
      }, {
        x: 6,
        y: 1250
      },
      {
        x: 7,
        y: 2505
      }, {
        x: 8,
        y: 2001
      },
      {
        x: 9,
        y: 88
      }, {
        x: 10,
        y: 650
      },
      {
        x: 11,
        y: 1350
      }, {
        x: 12,
        y: 200
      },
      {
        x: 13,
        y: 12782
      }, {
        x: 14,
        y: 1000
      },
      {
        x: 15,
        y: 50
      }, {
        x: 16,
        y: 500
      },
      {
        x: 17,
        y: 204
      }, {
        x: 18,
        y: 15
      },
      {
        x: 19,
        y: 250
      }, {
        x: 20,
        y: 1200
      },
      {
        x: 21,
        y: 200
      }, {
        x: 22,
        y: 200
      },
      {
        x: 23,
        y: 100
      }, {
        x: 24,
        y: 200
      },
      {
        x: 25,
        y: 450
      }
    ]
    
    
    async function createGraphData() {
      const ctx = document.getElementById('myChart').getContext('2d');
      const myChart = new Chart(ctx, {
        type: 'bar',
        data: {
          datasets: [{
            label: '# of Tokens',
            data: chartData,
            backgroundColor: 'rgb(255,165,3,0.8)',
          }]
        },
        options: {
          legend: {
            display: false
          },
          scales: {
            x: {
              type: 'linear',
              position: 'bottom',
              min: 0,
              max: 25,
              ticks: {
                stepSize: 1,
                color: 'white',
                autoSkip: false,
              },
              title: {
                display: true,
                text: 'Price $ (USD)',
                color: 'white'
              }
            },
            y: {
              beginAtZero: true,
              grid: {
                color: 'rgba(50,50,50,0.5)',
                z: 1
              },
              title: {
                display: true,
                text: 'Number of Tokens',
                color: 'white'
              },
              ticks: {
                color: 'white'
              }
            }
          },
          plugins: {
            legend: {
              display: false,
              labels: {
                color: 'white'
              }
            },
            title: {
              display: true,
              text: 'Chart Title',
              color: 'white',
              font: {
                size: 24
              }
            }
          },
          maintainAspectRatio: false,
          responsive: true,
          barPercentage: 0.7,
          categoryPercentage: 0.8,
        }
      });
    }
    
    createGraphData().catch(console.error);
    <head>
      <script src="https://cdn.jsdelivr.net/npm/chart.js"></script>
    </head>
    
    <body style="background-color: black;color: white;">
      <canvas id="myChart"></canvas>
    </body>
    Login or Signup to reply.
Please signup or login to give your own answer.
Back To Top
Search