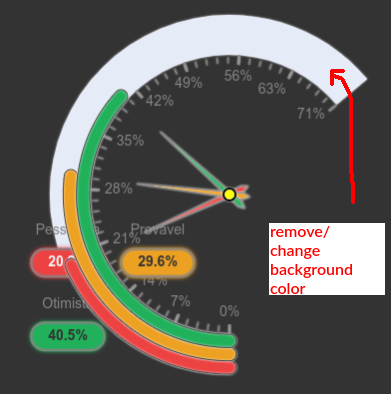
I would like to remove/change the background color (to transparent) of the area indicated below:
Code example:
<!DOCTYPE html>
<html lang="en">

  <head>
    <meta charset="UTF-8">
    <meta name="viewport" content="width=device-width, initial-scale=1.0">
    <title>ECharts Gauge Example</title>
    <!-- Inclua a biblioteca ECharts -->
      <script src="https://cdnjs.cloudflare.com/ajax/libs/echarts/5.2.2/echarts.min.js"></script>
  </head>

  <body>

    <!-- Crie um contêiner para o gráfico -->
    <div id="gaugeChart" style="width: 600px; height: 400px;"></div>

    <script>
      // Seu código ECharts aqui
      const gaugeData = [{
          value: 20
        },
        {
          value: 40
        }
      ];

      let myChart = echarts.init(document.getElementById('gaugeChart'));

      const option = {
        series: [{
          type: 'gauge',
          clockwise: false,
          startAngle: 140,
          endAngle: -90,
          min: 0,
          max: 100,
          pointer: {
            show: true
          },
          axisLabel: {
          color: 'red'
          },
          progress: {
            show: true,
            overlap: false,
            roundCap: true,
            clip: false
          },
          data: gaugeData
        }]
      };

      myChart.setOption(option);

    </script>

  </body>

</html>
I’ve tried setting itemStyle: {backgroundColor: 'transparent'} inside progress: {...} but it doesn’t work. How can I adjust it in gauge echarts?
- I changed the background color to emphasize the image of the graph and point out where I want to change it.


2
Answers
From the docs (https://echarts.apache.org/en/option.html#xAxis.axisLine.lineStyle.opacity) this would be configured with the
axisLine.lineStyleoption:You can also optionally adjust the width if you wish, you can see the other options from the linked docs.
you need to configure axisLine property as shown.