I have implemented an eCharts graph. See this fiddle:
https://jsfiddle.net/qgf4c2jy/3/
    option = {
        title: {
            text: 'Basic Graph'
        },
        tooltip: {},
        animationDurationUpdate: 1500,
        animationEasingUpdate: 'quinticInOut',
        series: [
            {
                type: 'graph',
                layout: 'none',
                symbolSize: 50,
                roam: true,
                label: {
                    show: true
                },
                edgeSymbol: ['circle', 'arrow'],
                edgeSymbolSize: [4, 10],
                edgeLabel: {
                    fontSize: 20
                },
                data: [
                    {
                        name: 'A',
                        x: 300,
                        y: 300
                    },
                    {
                        name: 'B',
                        x: 800,
                        y: 300
                    },
                    {
                        name: 'C',
                        x: 550,
                        y: 100
                    },
                    {
                        name: 'D',
                        x: 550,
                        y: 500
                    },
                    {
                        name: 'E',
                        x: 1000,
                        y: 300
                    },
                    {
                        name: 'F',
                        x: 1200,
                        y: 300
                    }
                ],
                // links: [],
                links: [
                    {
                        source: 'A',
                        target: 'C'
                    },
                    {
                        source: 'B',
                        target: 'C'
                    },
                    {
                        source: 'B',
                        target: 'D'
                    },
                    {
                        source: 'A',
                        target: 'D'
                    },
                    {
                        source: 'B',
                        target: 'E'
                    },
                    {
                        source: 'E',
                        target: 'F'
                    }
                ],
                lineStyle: {
                    opacity: 0.9,
                    width: 2,
                    curveness: 0
                }
            }
        ]
    };
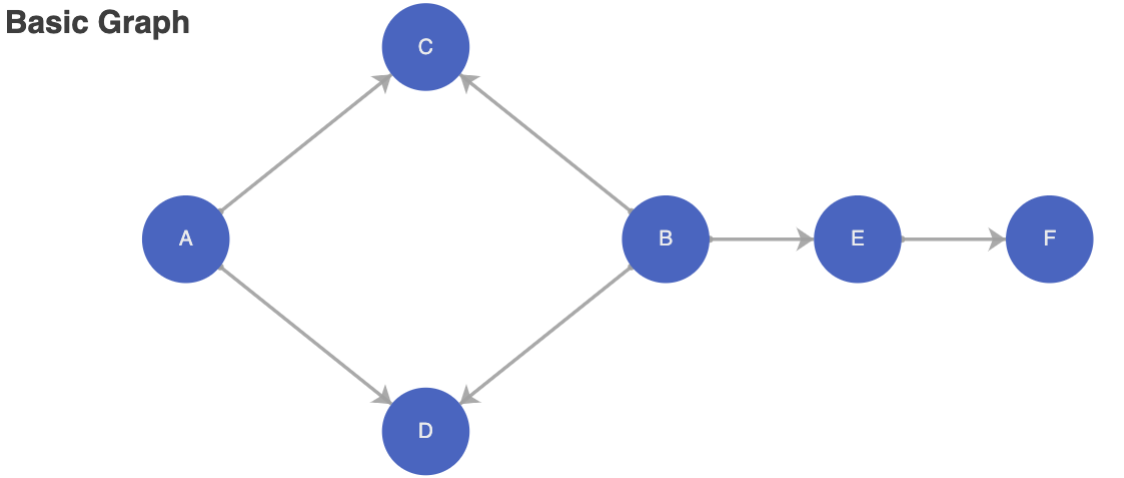
The resulting graph basically looks like this:
The x position of each node corresponds to the time axis. Thus, in this example graph, "E" happens before "F" and after "B".
How can I extend this graph with a DataZoom on the xAxis like in this example? https://echarts.apache.org/examples/en/editor.html?c=custom-error-scatter

 Question posted in


2
Answers
echarts gives one config key say
coordinateSystem. for more info:click hereHere, I have implemented basic example: EXAMPLE
Encoding the X/Y data as an array under the property
valuein thedataobject seems to work for coordinateSystemcartesian2d.Example: