skip to Main Content

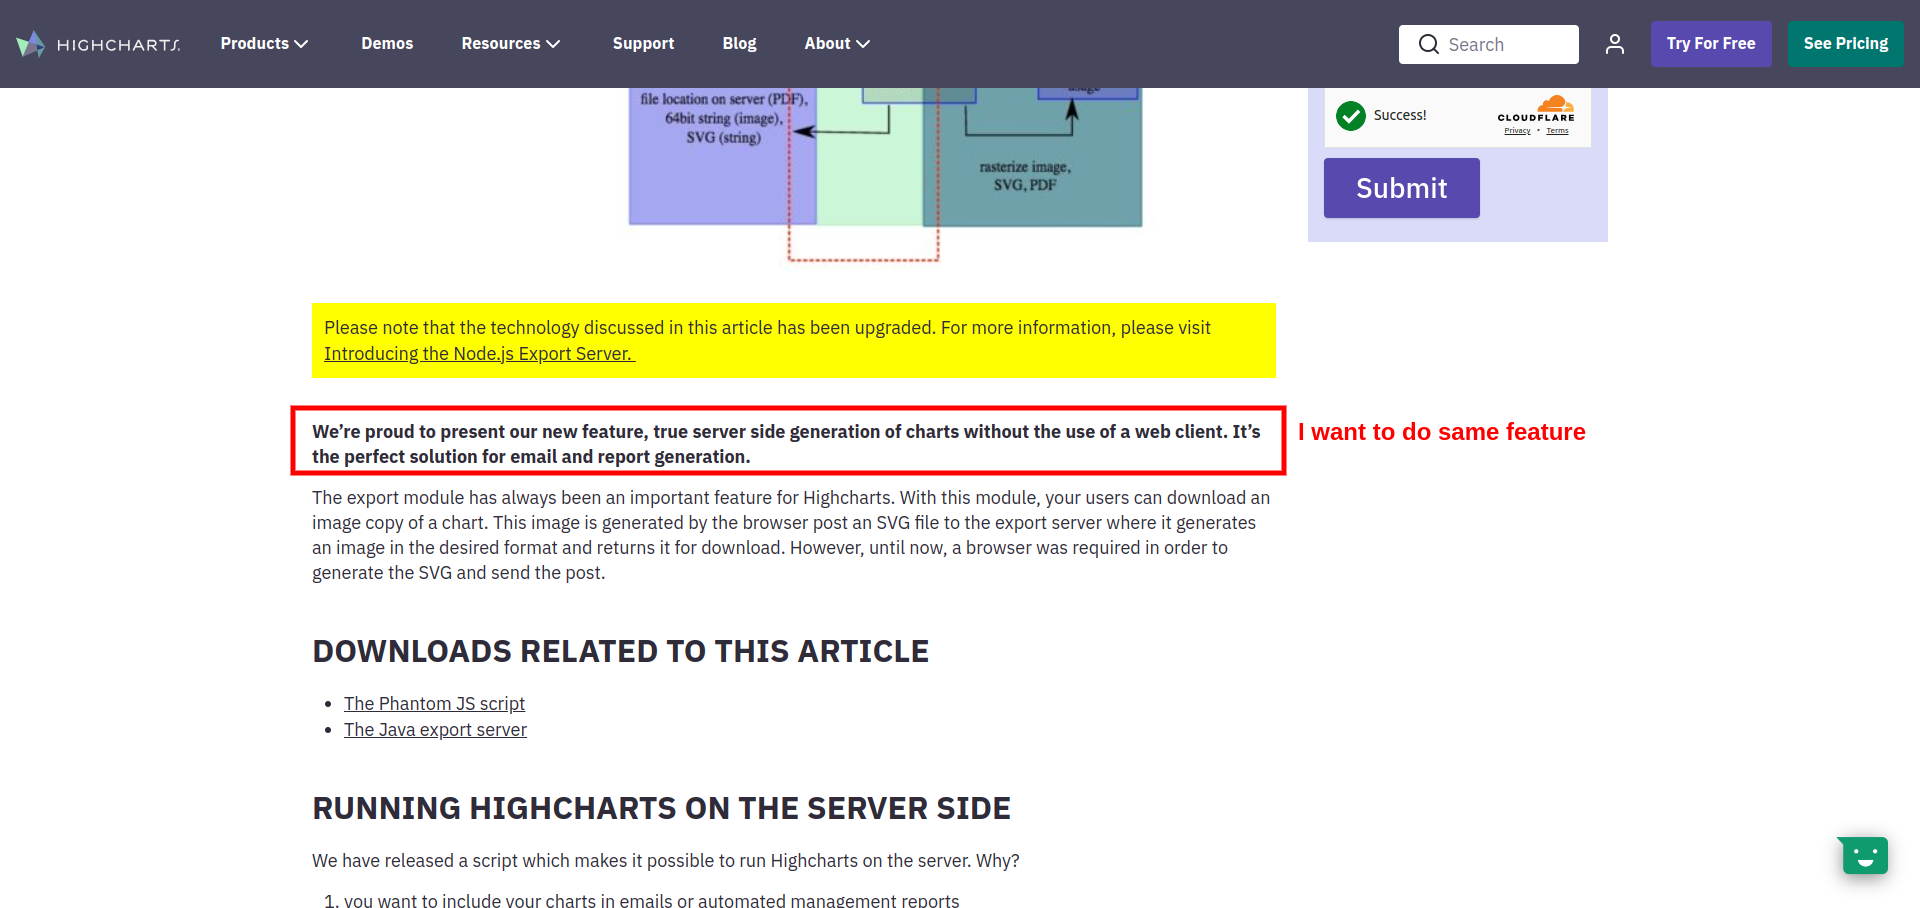
With highcharts, we have a built-in button to download the current chart (example: http://www.highcharts.com/demo/, this button: arrow). We can save it as PNG, JPEG, PDF or SVG.

Instead of downloading it on client side i want to download image on server and sent that image to particular user through email How could I do that using Node.js ?

enter image description here

I got this solution, but getting TypeError: chartExporter.export is not a function:-

const fs = require("fs");
const chartExporter = require("highcharts-export-server");

chartExporter.initPool();

let chartOptions = highchart chart option

chartExporter.export({
    type: "svg",
    outfile: "./output-file.svg",
    options: chartOptions
}, (err, res) => {
    console.log(`The chart has been succesfully generated as SVG at ${res.filename}!`);

    chartExporter.killPool();
});

How to resolve this issue or anyone has any other solution to fulfil my requirement

2

Answers


  1. According to your description,

    Instead of downloading it on client side i want to download image on
    server

    So your requirement is to fetch the image in to your NodeJS backend app and then send the image to the frontend/client.

    To achieve this, you need to make HTTP request from you NodeJS application to highcharts and you can use AXIOS or NodeJS HTTP module. Once you get the image into your application the second part is to send the image to your client. There are main two possible scenarios to do this as below,

    1. Send image link to the client (For this you need to store image somewhere)
    2. Send Base64 encoded image data to the client (You do not have to store the image anywhere)
    Login or Signup to reply.
  2. I think you got some wrong documentation the name of function is startExport
    Please try the code below

    const exporter = require('highcharts-export-server');
    const fs = require('fs')
    const path = require('path')
    
    async function run() {
        const data = {
            categories: ['Jan', 'Feb', 'Mar', 'Apr', 'May'],
            series: [{
                name: 'Los Angeles',
                data: [6, 7, 7, 7, 6]
            },{
                name: 'London',
                data: [3, 4, 3, 4, 3]
            }]
        };
    
        const exportSettings = {
            export: {
                type: 'png',
                options: {
                    chart: {
                        type: 'line'
                    },
                    title: {
                        text: 'My Chart'
                    },
                    xAxis: {
                        categories: data.categories
                    },
                    yAxis: {
                        title: {
                            text: 'Temperature (°C)'
                        }
                    },
                    series: data.series
                }
            }
        };
    
        const options = exporter.setOptions(exportSettings);
    
        await exporter.initPool(options);
    
        exporter.startExport(exportSettings, function (res, err) {
            if (err) {
                console.error('Error in exporting chart:', err);
                return;
            }
            const binaryData = Buffer.from(res.data, 'base64');
            exporter.killPool();
    
            const savepath = path.join(__dirname, './', 'output.png')
            fs.writeFile(savepath, binaryData, (err) => {
                if (err) {
                    console.error('Error in writing to image file:', err);
                    return;
                }
                console.log('File written successfully.');
            });
        });
    }
    
    run()
    
    Login or Signup to reply.
Please signup or login to give your own answer.
Back To Top
Search