skip to Main Content

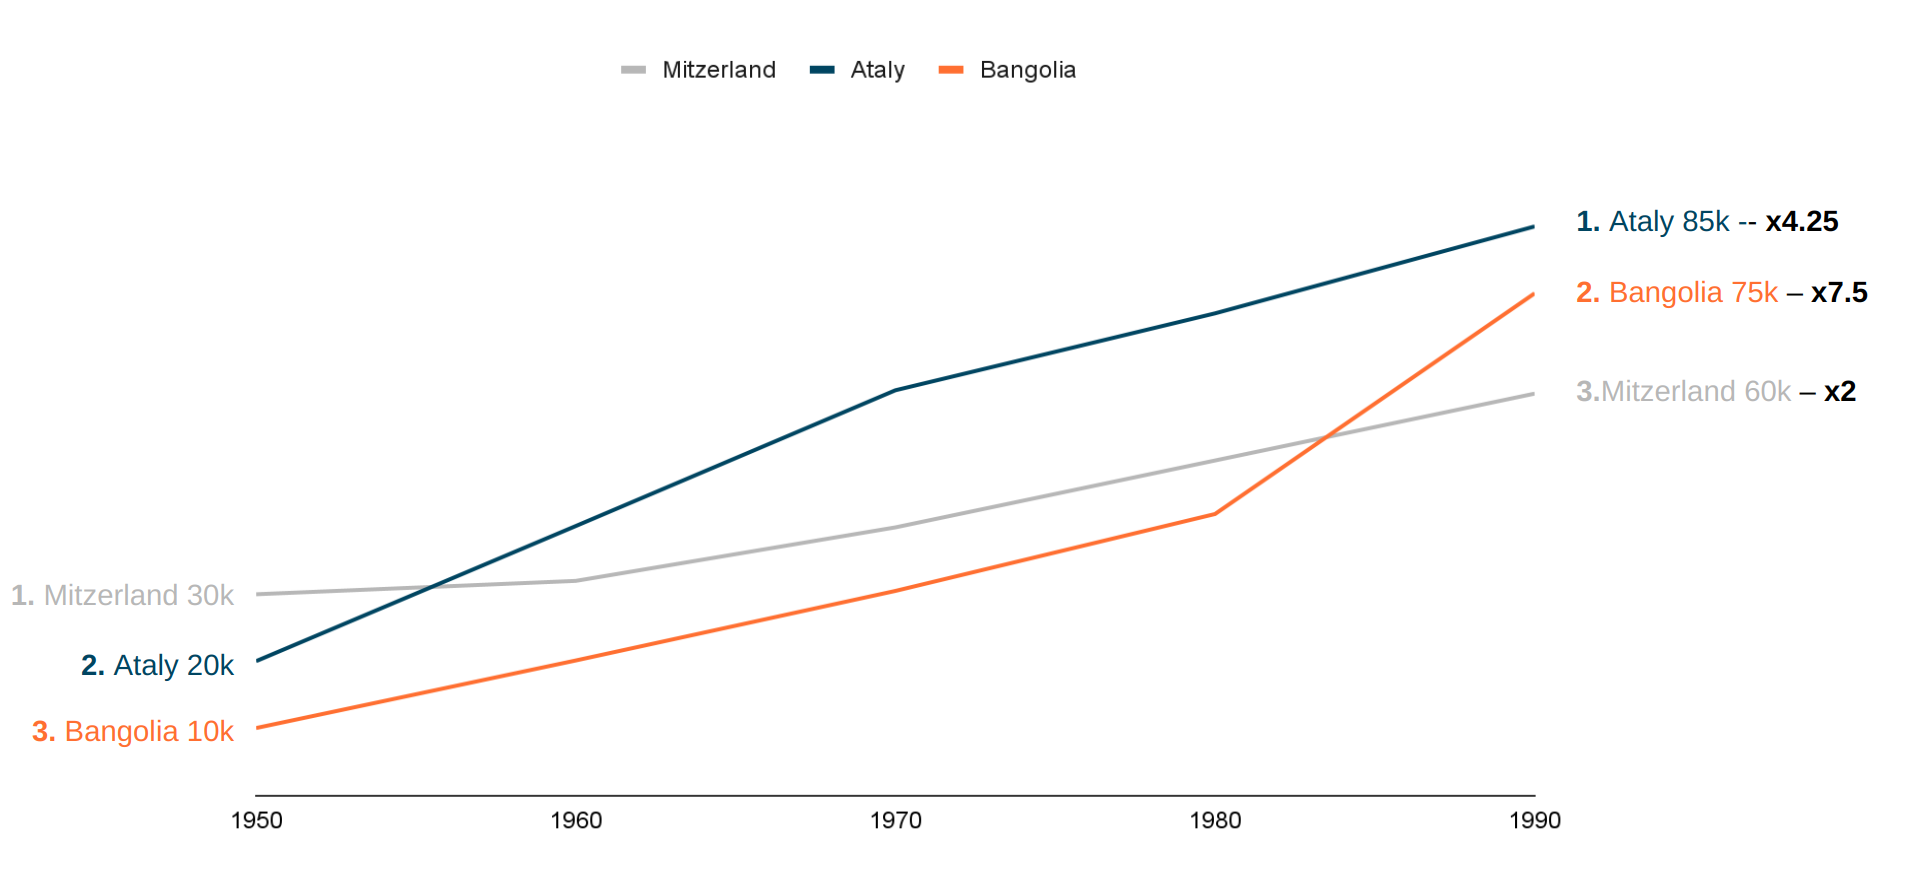
I would like to have line labels on both sides of a Y-axis, as in the following example:
enter image description here
I looked on ECharts examples and documentation, but I couldn’t find which series type or options would allow me to do that…

Here are the data used in the example:

|------------+--------+--------+--------+--------+-------+--------+--------+--------|
| Entity     | 1950.0 | 1960.0 | 1970.0 | 1980.0 |  1990 | Rank50 | Rank90 | Factor |
|------------+--------+--------+--------+--------+-------+--------+--------+--------|
| Mitzerland |  30000 |  32000 |  40000 |  50000 | 60000 |      1 |      3 |      2 |
| Ataly      |  20000 |  40200 |  60500 |  72000 | 85000 |      2 |      1 |    4.3 |
| Bangolia   |  10000 |  20100 |  30500 |  42000 | 75000 |      3 |      2 |    7.5 |
|------------+--------+--------+--------+--------+-------+--------+--------+--------|

2

Answers


  1. I dont think there is inbuilt support for that. Best I can think of right now is to use the regular endLabel for the end of the series and a markPoint with symbolSize 0 on top of the first datapoint as start label.

    Example:

    const dataset = [[150, 230, 224, 218, 135, 147, 260], [230, 160, 70, 135, 147, 140, 110], [135, 147, 260, 340, 290, 110, 90]];
    const entity = ['Mangolia', 'Mitzerland','Torsica'];
    
    const seriesList = [];
    for (const index in dataset) {
      const row = dataset[index];
      seriesList.push({
        type: 'line',
        data: row,
        endLabel: {
          show: true,
          formatter: () => 'end label = ' + row[row.length - 1]
        },
        markPoint: {
          symbolSize: 0,
          label: {position: 'left'},
          data: [{coord: [0, row[0]], value: entity[index]}]
        }
      });
    }
    
    option = {
      xAxis: {
        type: 'category',
        data: ['Mon', 'Tue', 'Wed', 'Thu', 'Fri', 'Sat', 'Sun']
      },
      yAxis: {
        type: 'value'
      },
      series: seriesList
    };
    
    Login or Signup to reply.
  2. You can use endLabel to show label at end.

    Also, to show label at start you can use Markpoint with formatter to show series name and start value.

    Example:

    Start label

    markPoint: {
      symbolSize: 0,
      label: {
        position: 'left', 
        formatter: (params)=> `${params.value} = ${params.data.coord[1]}`
      },
      data: [{coord: [0, row[0]], value: entity[index]}]
    }
    

    End label

    endLabel: {
      show: true,
      formatter: '{a} = {c}'
    },
    
    Login or Signup to reply.
Please signup or login to give your own answer.
Back To Top
Search