


I have currently using Apache Echart (version – 15.0.2) in angular 15.
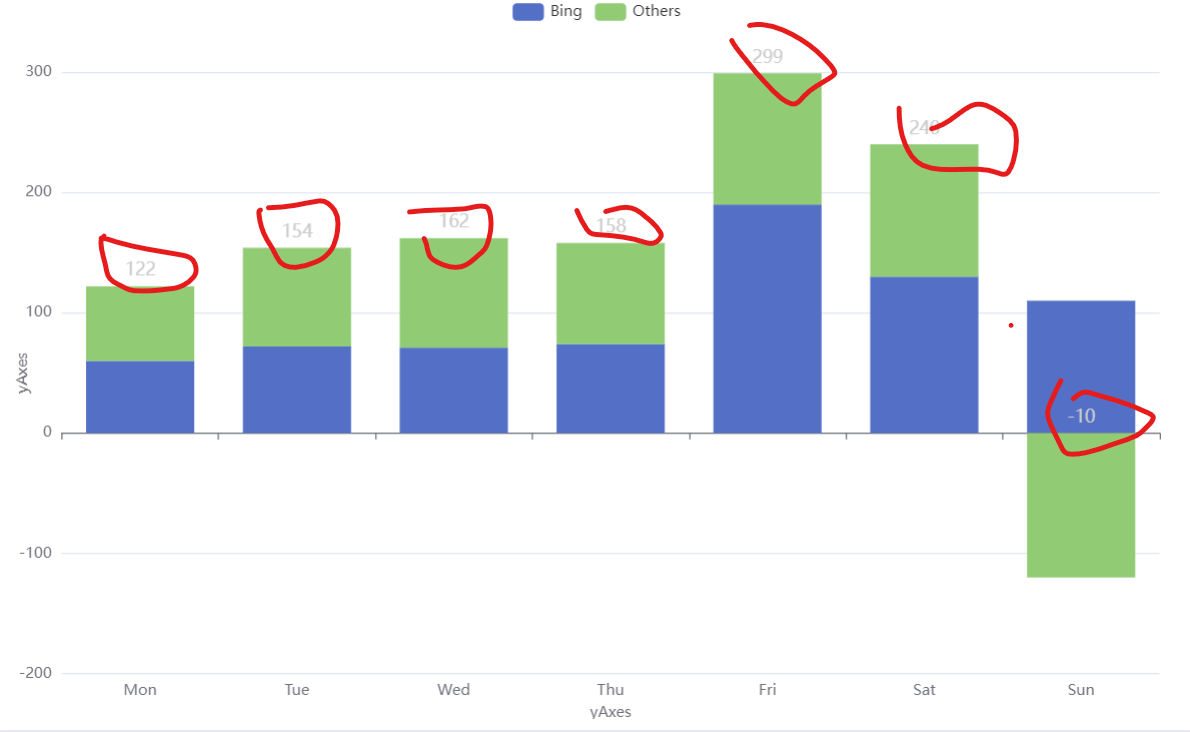
I have created a stack bar chart, here I have created a sum of series values, If I am getting positive value able to show the top based on the last index, but I getting negative value unable to show the bottom,
my expect result is if getting negative values need to show the bottom of stack bar chart column, below I have attached the print screen, please do needful.
My Result :
enter image description here
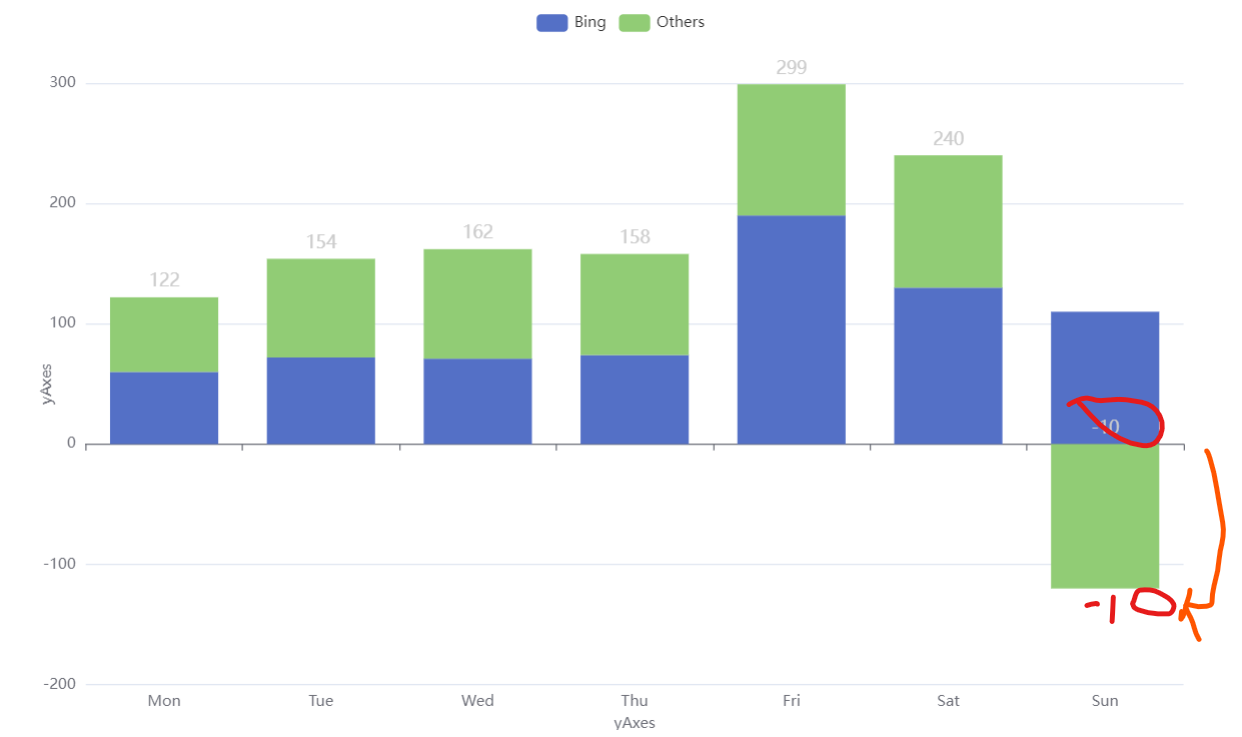
**Except Result : **
enter image description here
Here need to show negative value bottom for the stacked bar chart.
Source Code
const series = [
    {
      name: 'Bing',
      type: 'bar',
      stack: 'Search Engine',
      emphasis: {
        focus: 'series'
      },
      data: [60, 72, 71, 74, 190, 130, 110],
      avoidLabelOverlap: true
    },
    {
      name: 'Others',
      type: 'bar',
      stack: 'Search Engine',
      emphasis: {
        focus: 'series'
      },
      data: [62, 82, 91, 84, 109, 110, -120],
      avoidLabelOverlap: true
    }
  ];


option = {
  tooltip: {
    trigger: 'axis',
    axisPointer: {
      type: 'shadow'
    }
  },
  legend: {},
  grid: {
    left: '3%',
    right: '4%',
    bottom: '3%',
    containLabel: true
  },
  xAxis: {
        type: 'category',
        data: ['Mon', 'Tue', 'Wed', 'Thu', 'Fri', 'Sat', 'Sun'],

        name: 'yAxes',
        nameLocation: 'middle',
        nameGap: 25,
        alignTicks: true,
      },
  yAxis: {
        type: 'value',
        name: 'yAxes',
        nameLocation: 'middle',
        nameGap: 25,
        alignTicks: true,

      },
  series: series.map((item:any, index) => Object.assign(item, {
      type: 'bar',
      stack: true,
      label: {
        show: index === series.length - 1 ,
        fontSize: 14,
        color: '#ccc',
        position: 'top',
        formatter: function (param) {
          let sum = 0;
          series.forEach(item => {
            sum += item.data[param.dataIndex];
          });
          return sum

        }.bind(this),
      },
    }))
};
I am trying to below steps not working.
formatter: function (param) {
          let sum = 0;
          series.forEach(item => {
            sum += item.data[param.dataIndex];
          });
          sum > 0 ? item.label.position = 'top' : item.label.position = 'bottom'

          return sum

        }.bind(this),
**if getting positive value **
label : { show : true, position : 'top'}
**if getting negative value **
label : { show : true, position : 'bottom'}
2
Answers
Comments Workspace Echart LinkExample
Can you pls help this dataset @Matthias
Expected result : Expected result :
You can build a transparent helper bar with
label: {position: 'bottom'}to achieve the desired result.Example:
Alternatively you could put all labels on top by using the the formatter of both series based on the sign of the sum.
Example:
Example for multiple helper bars.