skip to Main Content

I’m working on a workflow component and I’m having a problem trying to place a marker-end on my path.

In my component, the user can double click on the red line (see screen) to reveal the curve point as well as the dotted connections (see screen). He can move the curve point to place it as he wishes. The problem is that the markerEnd is not placed on the path with the curve (red) but rather on the path without the curve (dotted).

Many don’t have this problem because their markerEnd is at the very end of their path. But in my case, I cannot put the markerEnd at the very end of my path because the end of it is in the center of the node (and therefore would be hidden).

Here are some explanations of my code.

So I have a path defined like this:

<path
    id={id}
    className="react-flow__edge-path"
    d={edgePath}
    markerEnd={'url(#triangular)'}
    style={style}
/>

The d attribute receives this as a variable:

var edgePath = "M"+(sourceNodesBounds['x'] + sourceNodesBounds['width'] / 2)+","+(sourceNodesBounds['y'] + sourceNodesBounds['height'] / 2)+",Q"+centerXUpdatable+","+centerYUpdatable+","+(targetNodesBounds['x'] + targetNodesBounds['width'] / 2)+","+(targetNodesBounds['y'] + targetNodesBounds['height'] / 2);

And here is the marker that I define and use as markerEnd for my path:

<defs>
    <marker 
        id='triangular' 
        orient="auto"
        refX='70' 
        refY='10'
        markerWidth="15" 
        markerHeight="15"
        markerUnits="strokeWidth"
    >
       <path d='M0,0 V16 L12,8 Z' fill="black" />
    </marker>
</defs>

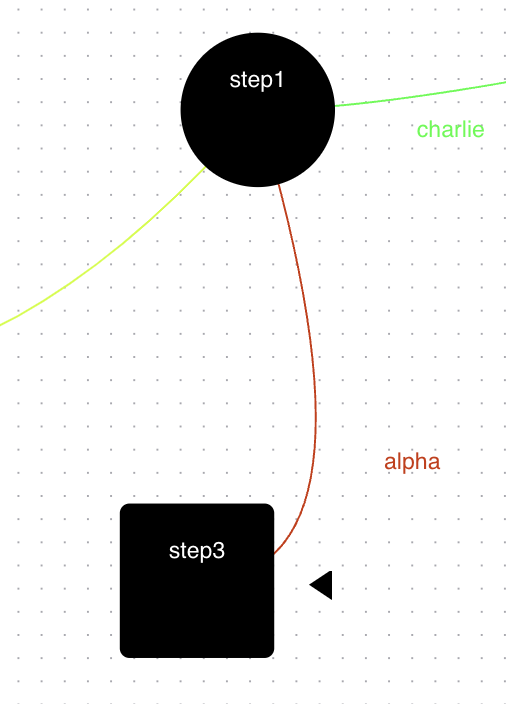
This is what the path and its markerEnd look like without triggering the update:
enter image description here

And this is what the path and its markerEnd look like when triggering the update:
enter image description here

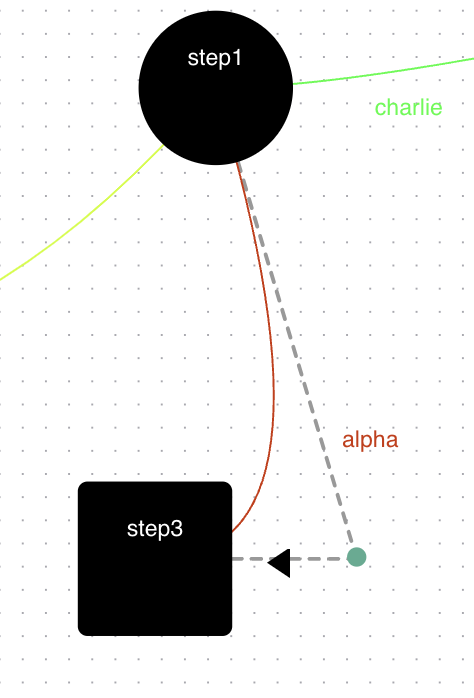
So as you can see, the markerEnd is placed on the line that connects the start point and the end point. I would like it to be placed on the red path but I don’t see how to go about it at all.
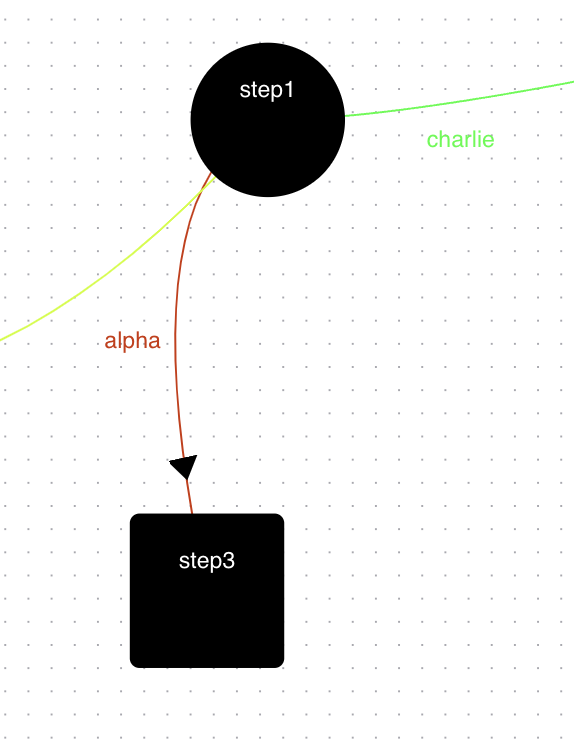
Like it:
enter image description here

I thank you in advance!

2

Answers


  1. You can split the curve into two Bezier segments and then provide a marker-mid for the middle vertex. There is a library that can do the splitting for you, but the math is just the most simple application of de Casteljau’s algorithm, where you use the intermediate interpolated points of one constant value of 0 ≤ t ≤ 1 as the control points for the split path.

    const interpolate = (p1, p2, t) => {
      return {
        x: p1.x * (1 - t) + p2.x * t,
        y: p1.y * (1 - t) + p2.y * t,
      }
    }
    
    const ser = p => `${p.x},${p.y}`;
    
    function split (start, control, end, t) {
      const c1 = interpolate(start, control, t);
      const c2 = interpolate(control, end, t);
      
      const p = interpolate(c1, c2, t);
      
      return `M ${ser(start)} Q ${ser(c1)} ${ser(p)} ${ser(c2)} ${ser(end)}`; 
    }
    
    const dots = {
      start: { x: 20, y: 80 },
      control: { x: 160, y: 80 },
      end: { x: 180, y: 20 }
    };
    
    for (const id of ['start', 'control', 'end']) {
      const dot = document.querySelector('#' + id);
      dot.setAttribute('cx', dots[id].x);
      dot.setAttribute('cy', dots[id].y);
    }
    
    document.querySelector('#visual')
      .setAttribute('d', `M ${ser(dots.start)} L ${ser(dots.control)} ${ser(dots.end)}`);
    
    const d = split(dots.start, dots.control, dots.end, 0.7);
    document.querySelector('#edge').setAttribute('d', d);
    svg {
      width: 100vw;
      height: 100vh;
      stroke-width: 2px;
      fill: none;
    }
    #visual {
      stroke: grey;
      stroke-dasharray: 5px;
    }
    #start, #end {
      stroke: darkgreen;
    }
    #control {
      fill: blue;
    }
    #edge {
      stroke: red;
      marker-mid: url(#triangular);
    }
    <svg viewBox="0 0 200 100">
      <marker 
            id='triangular' 
            orient="auto"
            refX='5' 
            refY='8'
            markerWidth="15" 
            markerHeight="16"
            markerUnits="userSpaceOnUse"
        >
           <path d='M0,0 V16 L12,8 Z' fill="black" />
        </marker>
        <path id="visual"/>
        <circle r="6" id="start"/>
        <circle r="6" id="control"/>
        <circle r="6" id="end"/>
        <path id="edge"/>
    </svg>
    Login or Signup to reply.
  2. Or not do any calculations at all and let SMIL position the "marker"

    At 77% of the line here:

    Needs some tweaking to prevent duplicate ID issues, maybe wrap it in a Web Component

    <svg height="360px" viewBox="0 0 600 600" stroke-width="15">
       <path id="p1" d="M100,100 C200,100 123,441 500,100" stroke="grey"  fill="none"></path>
       <path         d="M100,100 C200,100 123,441 500,100" stroke="green" fill="none" 
                     pathLength="100" stroke-dasharray="77 100"></path>
       <path id="arrow" d="m0 -15 30 15-30 15z" fill="red">         
         <animateMotion rotate="auto" fill="freeze" calcMode="linear"
                        dur="0.001s"  keyPoints="0;0.77" keyTimes="0;1" >
            <mpath href="#p1"></mpath>
         </animateMotion>
       </path>
    </svg>
    Login or Signup to reply.
Please signup or login to give your own answer.
Back To Top
Search