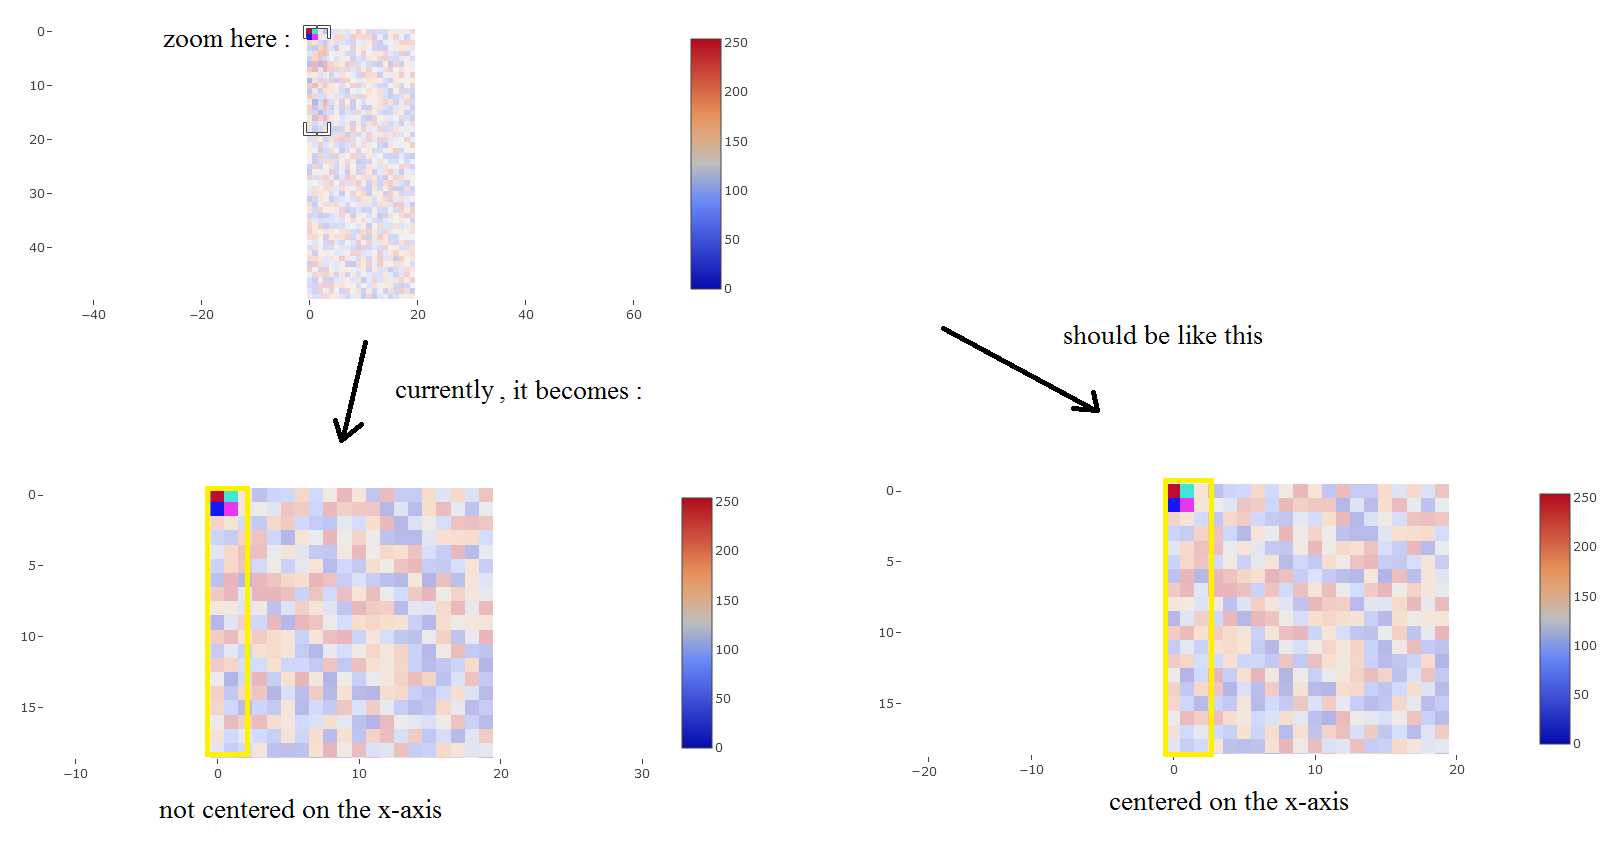
The following code (see Keep square pixels + ability to have any rectangular shape zoom with Plotly.js, with a plot with 2 layers and Zoom on a Plotly heatmap) works to create a Plotly heatmap that:
- has squared pixels,
- allows any rectangular-shaped zoom (and not stuck on the heatmap’s aspect ratio),
- has multiple layers / traces.
However, when selecting a rectangle zone to zoom into, this zone is not centered after zooming, whereas:
- the zoomed zone should be centered on x-axis
- the zoomed zone should be centered on y-axis
How to achieve this standard UX with Plotly.js? (standard in many software that have a rectangle zooming UX, such as Matplotlib, Photoshop, etc.)
Example:
const z = Array.from({ length: 50 }, () => Array.from({ length: 20 }, () => Math.floor(Math.random() * 255)));
const z2 = [[[255, 0, 0], [0, 255, 255]], [[0, 0, 255], [255, 0, 255]]];
const data = [{ type: "image", z: z2 }, { type: "heatmap", z: z, opacity: 0.3 }];
const layout = {
  xaxis: { constrain: 'range', constraintoward: 'center', scaleanchor: "y", scaleratio: 1, zeroline: false, showgrid: false },
  yaxis: { constrain: 'range', constraintoward: 'center', showgrid: false, zeroline: false }
};
Plotly.newPlot('plot', data, layout).then(afterPlot);
function afterPlot(gd) {
  const xrange = gd._fullLayout.xaxis.range;
  const yrange = gd._fullLayout.yaxis.range;
  const xrange_init = [...xrange];
  const yrange_init = [...yrange];
  const zw0 = Math.abs(xrange[1] - xrange[0]);
  const zh0 = Math.abs(yrange[1] - yrange[0]);
  const r0 = Number((zw0 / zh0).toPrecision(6));
  const update = { 'xaxis.range': xrange, 'yaxis.range': yrange, 'xaxis.scaleanchor': false, 'yaxis.scaleanchor': false };
  Plotly.relayout(gd, update);
  gd.on('plotly_relayout', relayoutHandler);
  function relayoutHandler(e) {
    if (e.width || e.height) {
      return unbindAndReset(gd, relayoutHandler);
    }
    if (e['xaxis.autorange'] || e['yaxis.autorange']) {
      [xrange[0], xrange[1]] = xrange_init;
      [yrange[0], yrange[1]] = yrange_init;
      return Plotly.relayout(gd, update);
    }
    const zw1 = Math.abs(xrange[1] - xrange[0]);
    const zh1 = Math.abs(yrange[1] - yrange[0]);
    const r1 = Number((zw1 / zh1).toPrecision(6));
    if (r1 === r0) {
      return;
    }
    const [xmin, xmax] = getExtremes(gd, 1, 'x');
    const [ymin, ymax] = getExtremes(gd, 1, 'y');
    if (r1 > r0) {
      const extra = (zh1 * r1/r0 - zh1) / 2;
      expandAxisRange(yrange, extra, ymin, ymax);
    }
    if (r1 < r0) {
      const extra = (zw1 * r0/r1 - zw1) / 2;
      expandAxisRange(xrange, extra, xmin, xmax);
    }
    Plotly.relayout(gd, update);
  }
}
function unbindAndReset(gd, handler) {
  gd.removeListener('plotly_relayout', handler);
  const _layout = {
    xaxis: {scaleanchor: 'y', scaleratio: 1, autorange: true},
    yaxis: {autorange: true}
  };
  return Plotly.relayout(gd, _layout).then(afterPlot);
}
function getExtremes(gd, traceIndex, axisId) {
  const extremes = gd._fullData[traceIndex]._extremes[axisId];
  return [extremes.min[0].val, extremes.max[0].val];
}
function expandAxisRange(range, extra, min, max) {
  const reversed = range[0] > range[1];
  if (reversed) {
    [range[0], range[1]] = [range[1], range[0]];
  }
  let shift = 0;
  if (range[0] - extra < min) {
    const out = min - (range[0] - extra);
    const room = max - (range[1] + extra);
    shift = out <= room ? out : (out + room) / 2;
  }
  else if (range[1] + extra > max) {
    const out = range[1] + extra - max;
    const room = range[0] - extra - min;
    shift = out <= room ? -out : -(out + room) / 2;
  }
  range[0] = range[0] - extra + shift;
  range[1] = range[1] + extra + shift;
  if (reversed) {
    [range[0], range[1]] = [range[1], range[0]];
  }
}
<script src="https://cdn.plot.ly/plotly-2.26.0.min.js"></script>
<div id="plot"></div>
 Question posted in


2
Answers
Ready-to-use snippet based on @EricLavault's answer:
In fact, I added a parameter (that I shouldn’t have added), which puts the plotted data visibility before the actual zoom shape drawn by the user when re-centering (ie. expand the axis range "towards more data" so that more data are visible rather than expanding evenly around the zoom window even if it includes an empty area). I knew this could be problematic so I ensured that this range "shift" can be easily discarded, but I completely forgot to mention this in the previous answer.
So, this happens in the
expandAxisRange()function, you can comment or just remove the lines involving theshiftparameter, which simplify things as you don’t need themin&maxparameters either, nor thegetExtremes()function), eg.