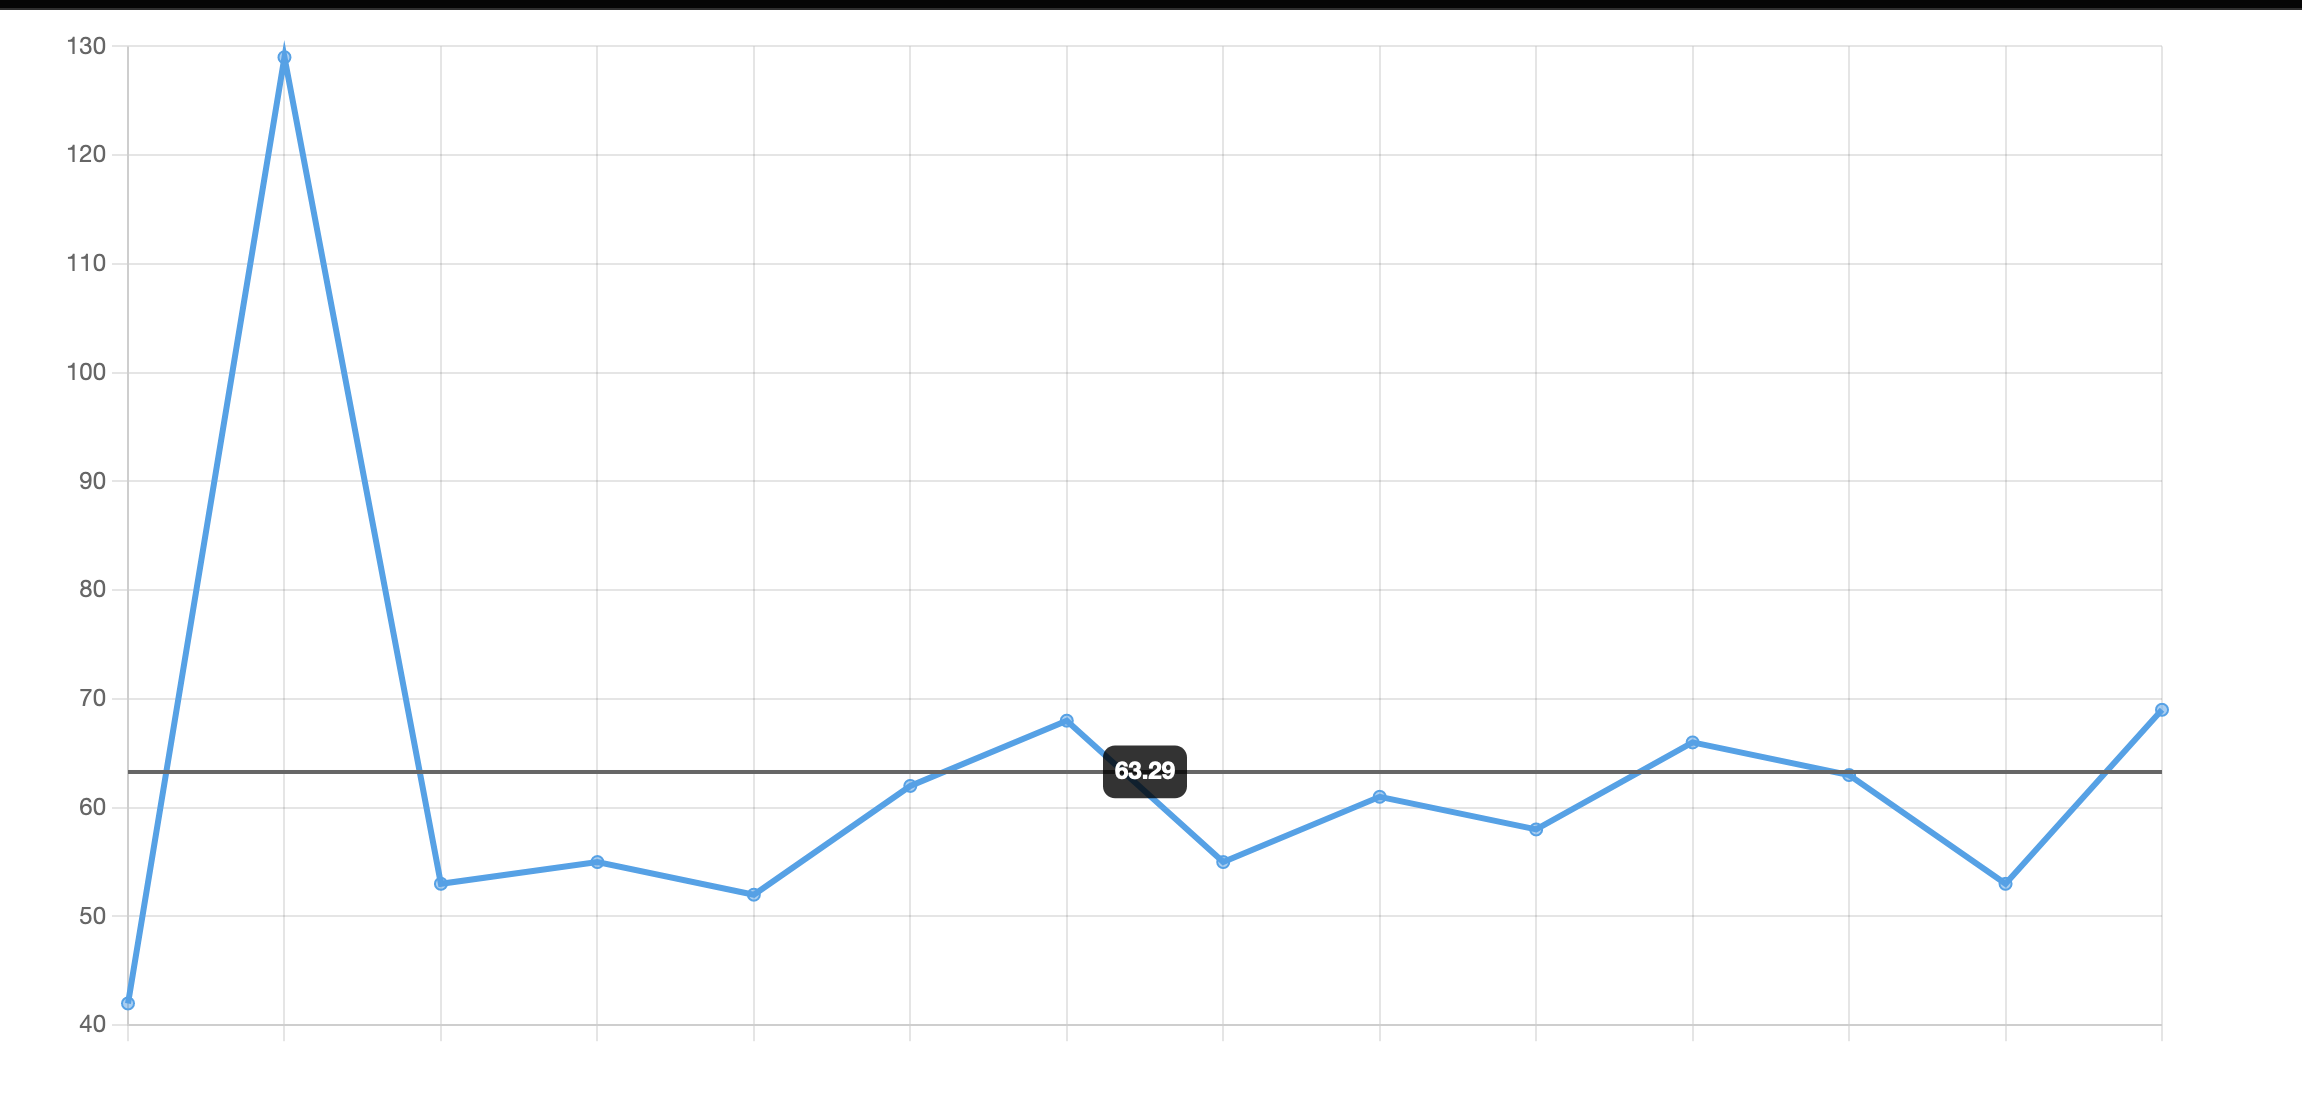
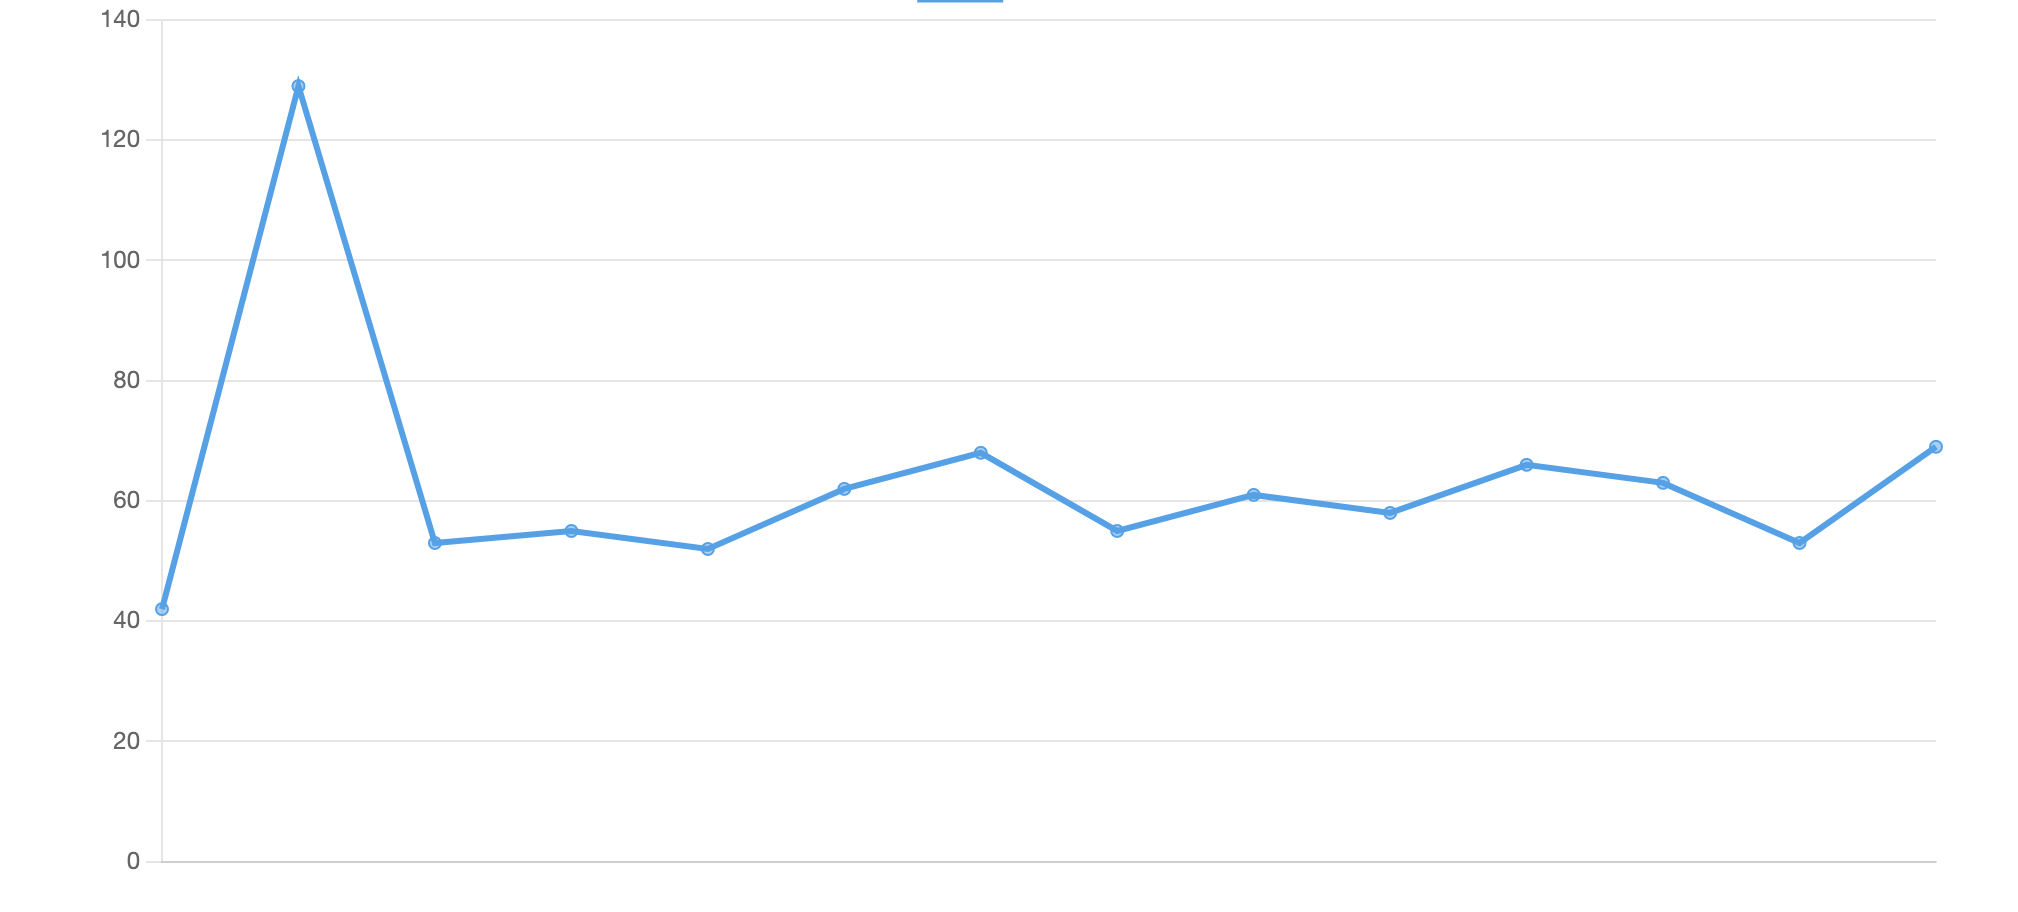
What’s the correct configuration to add a line annotation to a chart.js chart where the x-axis is of the ‘timeseries’ type?
Without the timeseries the following code works as expected.
function average(ctx) {
  const values = ctx.chart.data.datasets[0].data;
  return values.reduce((a, b) => a + b, 0) / values.length;
}

const ctx = document.getElementById('chart');

const mean = {
  type: 'line',
  drawTime: 'afterDraw',
  label: {
    display: true,
    content: (ctx) => average(ctx).toFixed(2),
   },
   scaleID: 'y',
   value: (ctx) => average(ctx)
 };

const chart = new Chart(ctx, {
  type: 'line',
  data: {
     labels:   ['', '', '', '', '', '', '', '', '', '', '', '', '', ''],
     datasets: [
       { data: [42, 129, 53, 55, 52, 62, 68, 55, 61, 58, 66, 63, 53, 69] }
     ]
  },
  options: {
    plugins: {,
       annotation: {
         annotations: {
          mean
         }
      }
    }
  }
});
However, when I introduce the timeseries
function average(ctx) {
  const values = ctx.chart.data.datasets[0].data;
  return values.reduce((a, b) => a + b, 0) / values.length;
}

const ctx = document.getElementById('chart');

const mean = {
  type: 'line',
  drawTime: 'afterDraw',
  label: {
    display: true,
    content: (ctx) => average(ctx).toFixed(2),
   },
   scaleID: 'y',
   value: (ctx) => average(ctx)
 };

const chart = new Chart(ctx, {
  type: 'line',
  data: {
    datasets: [
      {
        data: [
        { x: '2023-04-03 10:32:09', y: 42 },
        { x: '2023-04-03 10:32:16', y: 129 },
        { x: '2023-04-03 10:32:29', y: 53 },
        { x: '2023-04-03 10:32:37', y: 55 },
        { x: '2023-04-03 10:32:44', y: 52 },
        { x: '2023-04-03 10:32:51', y: 62 },
        { x: '2023-04-03 10:33:04', y: 68 },
        { x: '2023-04-03 10:33:12', y: 55 },
        { x: '2023-04-03 10:33:26', y: 61 },
        { x: '2023-04-03 10:34:11', y: 58 },
        { x: '2023-04-03 10:34:27', y: 66 },
        { x: '2023-04-03 10:34:34', y: 63 },
        { x: '2023-04-03 10:34:48', y: 53 },
        { x: '2023-04-03 10:34:55', y: 69 } ]
      },
    ]
  },
  options: {
    scales: {
      x: {
        type: 'timeseries',
        time: { unit: 'hour' },
        ticks: { beginAtZero: true }
      }
    },
    plugins: {
       annotation: {
         annotations: {
          mean
        }
      }
    }
  }
});
The annotation is not rendered.
Am I missing anything here?


2
Answers
You should import the date adapter library as mentioned in the [documentation]
While in the annotation which you are drawing a line indicating the average,
bis an object, instead, I believe that you should get the value withb.y.Demo @ StackBlitz
The issue is the average function. When you are using "data points" (objects as data), you have to use the property of the object which is representing the Y data.