skip to Main Content

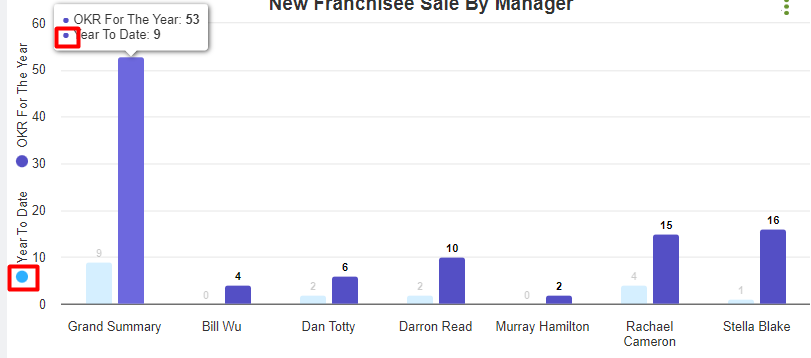
When hover on column bar the tooltip should show two colors for OKR for the year and Year to date but it is showing same colors.
I am using this script.

tooltip: { 
                formatter: function() {  
                      
                    let xAxisValue = this.point.name;  
                    let yAxisValue = this.y;
                    let xAxisName = this.series.name;
                    
                    if(hasMultipleCols){
 
                        if(typeof chartArrayData[1] != 'undefined') {
 
                            yAxisValue =  chartArrayData[1].data[this.point.index]; // this.point.name == undefined ? this.point.y : this.point.name
                            xAxisValue =  chartArrayData[0].data[this.point.index];
                            xAxisName  =  chartArrayData[0].name;
                            yAxisName =   chartArrayData[1].name;
                        }
                         
                     }
                     return `<span style="color:${this.color}">●</span> ${yAxisName }: <b>${ yAxisValue}</b><br/><span style="color:${this.color}">●</span> ${xAxisName}: <b>${xAxisValue }</b>`;
                     
                },  
            }

Please attachment

enter image description here
Please guide me.

Thanks

2

Answers


  1. Change the color to a static variable, if the color is still the same with bar,
    maybe you should check the colorByPoint property. if it’s true, the color of the tooltip is set to the color of the point.

    the two this.color target to the same point, so change the second on to another’s color.

    Plan 1: add a shared: true property to share the info between bars.

    like this 👇

      tooltip: {
        formatter: function () {
        // something your code here.
          let secondColor = this.points && this.points.length > 1 ? this.points[1].color : this.color;
          return `<span style="color:${this.color}">●</span> yAxisName1: <b>yAxisName12</b><br/><span style="color:${secondColor}">●</span> xAxisName1: <b>xAxisName2</b>`
        },
        shared: true
      },
    

    Plan 2: get color by:

    this.point.series.xAxis.series[1].color

    Login or Signup to reply.
  2. The easiest way is to enable the shared option for tooltip:

    tooltip: {
      shared: true
    }
    

    However, if you want to keep your custom format, you can use the below formatter function:

      tooltip: {
        formatter: function() {
          const options = this;
          const allSeries = options.series.chart.series;
          let result = `<span style="color:${this.color}">●</span> ${options.series.name}: <b>${options.y}</b>`;
    
          allSeries.forEach(series => {
            if (series !== options.series) {
              result += `<br/><span style="color:${series.color}">●</span> ${series.name}: <b>${series.points[options.x].y}</b>`;
            }
          });
    
          return result;
        }
      }
    

    Live demo: http://jsfiddle.net/BlackLabel/2gkx851w/

    API Reference:

    https://api.highcharts.com/highcharts/tooltip.formatter

    https://api.highcharts.com/highcharts/tooltip.shared

    Login or Signup to reply.
Please signup or login to give your own answer.
Back To Top
Search