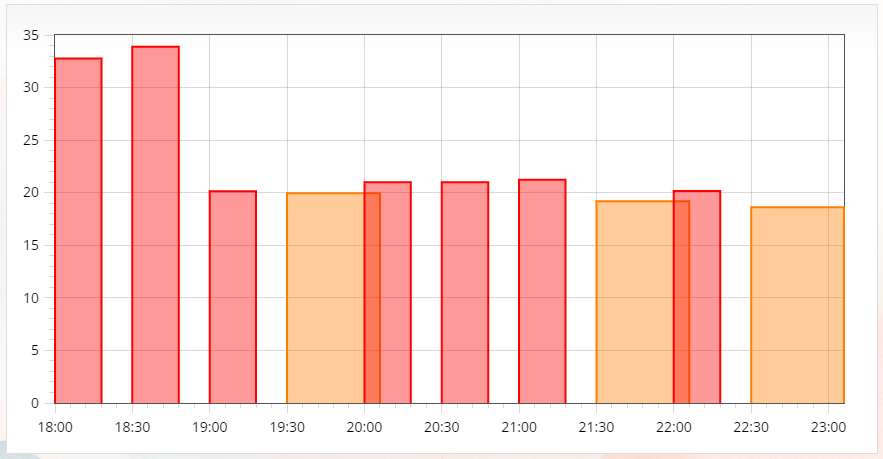
I’m attempting to draw a flot chart.
- bar chart
- time on the x-axis
- all bars should be the same x-size (width)
Here’s the code used:
var data = [{
    color: '#ff7e00',
    data: [
        [1692473400, 19.95],
        [1692480600, 19.194],
        [1692484200, 18.606],
    ]
}, {
    color: '#ff0000',
    data: [
        [1692468000, 32.76],
        [1692469800, 33.894],
        [1692471600, 20.139],
        [1692475200, 21],
        [1692477000, 21],
        [1692478800, 21.231],
        [1692482400, 20.16],
    ]
}];

$.plot("#pricesToday", data, {
    series: {
        bars: {
            show: true,
            barWidth: 0.6,
            align: "left"
        }
    },
    xaxis: {
        mode: "time",
        timeformat: "%H:%M",
        timezone: "none"
    }
});
This gives the below render:
As you can see, it is not equally sized, despite seeing barWidth: 0.6,
Is this a mistake I’ve made? How do I force it to be equal sized?
It could be a bug, but I wanted to check this before I raise a bug report.
Thanks


2
Answers
After some investigation: this is ONLY a valid bug on the github version of flot. Archived/hosted versions do not have this bug, such as
For all others, suggest you use a tagged version of 0.8.3 until this is fixed.
I raised a bug: https://github.com/flot/flot/issues/1856
TLDR: Do not use
https://github.com/flot/flotmaster branchFixed Width: If you set barWidth to a numeric value (e.g., barWidth: 0.6), it specifies the width of each bar in the x-axis units. This means that regardless of the x-axis data range or the number of data points between two bars, they will have a fixed width.
Automatic Width: If you set barWidth to a special value like auto, Flot will automatically calculate the width of the bars based on the spacing between data points and the number of bars to be displayed. This can be useful when you want the bars to fill the available space evenly.
The choice between a fixed width and automatic width depends on your specific chart and design requirements. For fixed-width bars, you need to determine a suitable width that fits your data and visualization preferences. For automatic width, Flot will handle the calculation for you.
Remember that the actual width of the bars can also be affected by other factors such as the size of the plot container and the margins set in the plot configuration. So, you may need to adjust other settings as well to achieve the desired bar width in your chart.