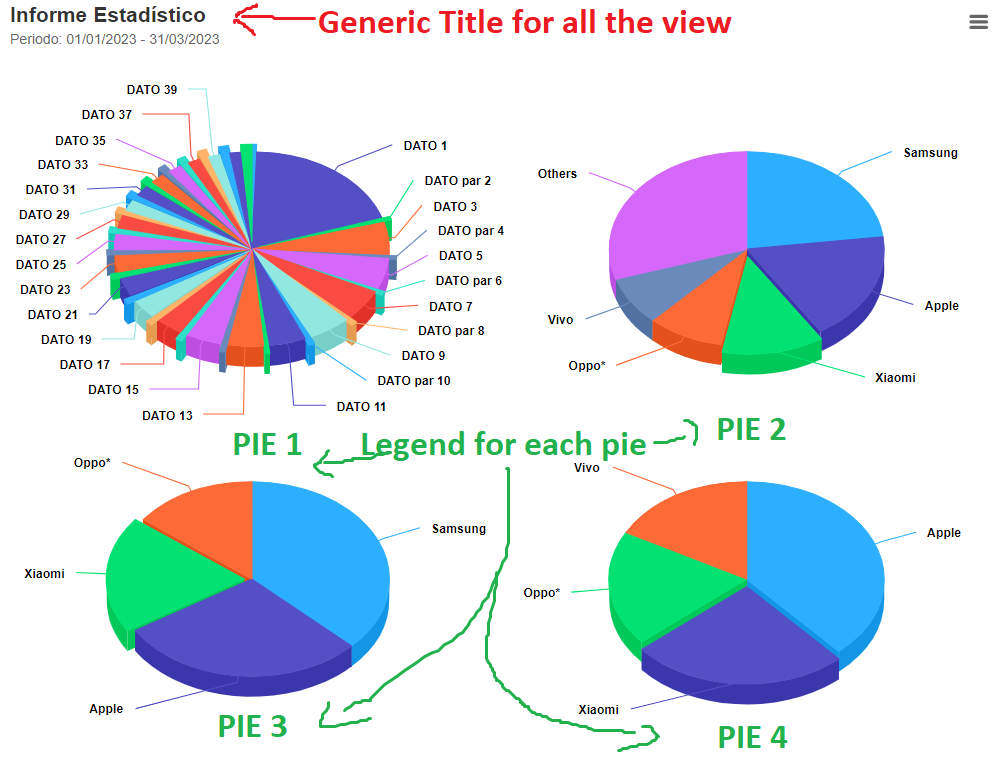
I’m using Highcharts library to display graphics. Now I’m displaying multiples series in one "page". As you can see, the page has one title above all. Thats a "generic" title for all the page, but I want each pie graphic to have their own title/legend. How can I do that (the subtitle in green: PIE 1, PIE 2, etc…)?
I can’t have 4 different charts because I need to generate the PNG/PDF with the 4 pies together. Not one PDF for pie.
Here is the code I’m using:
<asp:Content ID="Content2" ContentPlaceHolderID="MainContent" runat="server">

    <script type="text/javascript" src="https://code.highcharts.com/highcharts.js"></script>
    <script type="text/javascript" src="https://code.highcharts.com/highcharts-3d.js"></script>
    <script type="text/javascript" src="https://code.highcharts.com/modules/exporting.js"></script>
    <script type="text/javascript" src="https://code.highcharts.com/modules/export-data.js"></script>
    <script type="text/javascript" src="https://code.highcharts.com/modules/accessibility.js"></script>


    <script type="text/javascript">

        $(document).ready(function () {

            $.ajaxSetup({ cache: false });
            $.ajaxSetup({ 'async': false });

            var myData = [18, 635, 21, 177, 20, 165, 22, 163, 24, 162, 25, 145, 19, 143,
                23, 139, 26, 112, 27, 110, 28, 104, 30, 91, 29, 88, 31, 68, 32,
                57, 36, 55, 34, 53, 33, 51, 35, 46, 37, 44, 39, 42, 43];
            var mySeries = [];
            for (var i = 0; i < myData.length; i++) {
                if (i % 2 == 0) {
                    mySeries.push({
                        name: "DATO par " + i,
                        y: myData[i],
                        sliced: true,
                        selected: true
                    });
                }
                else
                    mySeries.push(["DATO " + i, myData[i]]);

            }

            Highcharts.setOptions({
                lang: { //Cambiamos el texto de las opciones
                    downloadPNG: "Descargar PNG",
                    downloadPDF: "Descargar PDF"
                }
            });

            Highcharts.chart('container', {
                chart: {
                    type: 'pie',
                    options3d: {
                        enabled: true,
                        alpha: 45,
                        beta: 0
                    },
                    height: 700
                },
                title: {
                    text: 'Informe Estadístico',
                    align: 'left'
                },
                subtitle: {
                    text: 'Periodo: 01/01/2023 - 31/03/2023',
                    align: 'left'
                },
                accessibility: {
                    point: {
                        valueSuffix: '%'
                    }
                },
                tooltip: {
                    pointFormat: '{series.name}: <b>{point.percentage:.1f}%</b>'
                },
                plotOptions: {
                    pie: {
                        allowPointSelect: true,
                        cursor: 'pointer',
                        depth: 35,
                        dataLabels: {
                            enabled: true,
                            format: '{point.name}'
                        }
                    }
                },
                credits: {
                    enabled: false
                },
                exporting: {
                    buttons: {
                        contextButton: {
                            menuItems: ["downloadPNG", "downloadPDF"]
                        }
                    },
                    sourceWidth: 900
                },
                //exporting: { enabled: false }, -> lo quita todo
                series: [
                    //Grafica 1
                    {
                        size: 250,
                        center: [200, 150],
                        type: 'pie',
                        name: 'Porcentaje',
                        description: 'PIE 1', //NO USE :(
                        data: mySeries
                    },
                    //Grafica 2
                    {
                        size: 250,
                        center: [650, 150],
                        type: 'pie',
                        name: 'Share',
                        data: [
                            ['Samsung', 23],
                            ['Apple', 18],
                            {
                                name: 'Xiaomi',
                                y: 12,
                                sliced: true,
                                selected: true
                            },
                            ['Oppo*', 9],
                            ['Vivo', 8],
                            ['Others', 30]
                        ]
                    },
                    //Grafica 3
                    {
                        size: 250,
                        center: [200, 450],
                        type: 'pie',
                        name: 'Share',
                        data: [
                            ['Samsung', 23],
                            ['Apple', 18],
                            {
                                name: 'Xiaomi',
                                y: 12,
                                sliced: true,
                                selected: true
                            },
                            ['Oppo*', 9],
                        ]
                    },
                    //Grafica 4
                    {
                        size: 250,
                        center: [650, 450],
                        type: 'pie',
                        name: 'Share',
                        data: [
                            ['Apple', 18],
                            {
                                name: 'Xiaomi',
                                y: 12,
                                sliced: true,
                                selected: true
                            },
                            ['Oppo*', 9],
                            ['Vivo', 8]
                        ]
                    }
                ]
            });
        });

    </script>

    <figure class="highcharts-figure">
    <div id="container"></div>
    <p class="highcharts-description">
        <i>*OPPO includes OnePlus since Q3 2021</i><br/><br/>
        Chart demonstrating the use of a 3D pie layout.
    </p>
    </figure>


</asp:Content>


2
Answers
Try to put subtitle instead of title.
If this doesn’t work, here is the documentation and a small example:
To give the chart individual titles for each one, simply pass the parameters in
var subtitle = {}Basic example:
Full example Link
http://www.w3big.com/try/try.php?filename=highcharts_bar_basic
Documentation Link
http://www.w3big.com/highcharts/highcharts-setting-detail.html#gsc.tab=0
In this fragment try for example:
//Grafica 1
OficialDocumentationLink: https://www.highcharts.com/demo/highcharts/line-ajax
Highcharts do not have the option of adding several legends, the most sensible solution to have a separate legend and title for each pie is to create separate charts with common options set using the
setOptions()method.Demo: https://jsfiddle.net/BlackLabel/pq3odaw2/
API: https://api.highcharts.com/highcharts/plotOptions.series.showInLegend