skip to Main Content

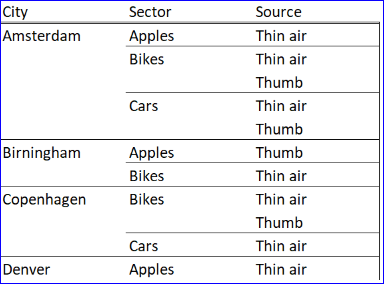
Is it possible in Vega-Lite to have multiple (hierarchical) facets of a dimension on one axis or would that require Vega?

Desired structure

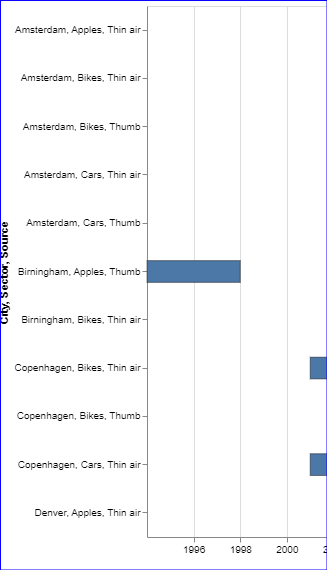
Best result I found so far was concatenating the information, which is effective but way less appealing:

All labels are repeated every row

If I create row-facets, two problems arise: 1) I cannot nest facets, therefore this does not work for 3 or more aspects. 2) all labels are repeated even if there’s no data, eg Copenhagen, Apples, Thin Air in the example.

2

Answers


  1. Yes, follow the example listed in the docs here:

    enter image description here

    Example

    Login or Signup to reply.
  2. Maybe a trellis grid could be suitable here?

    enter image description here

    {
      "$schema": "https://vega.github.io/schema/vega-lite/v5.json",
      "data": {
        "values": [
          {
            "BI_City": "Amsterdam",
            "BI_Sector": "Cars",
            "Source": "Thin air",
            "Start": "2002-01-01",
            "End": "2008-01-01"
          },
          {
            "BI_City": "Amsterdam",
            "BI_Sector": "Cars",
            "Source": "Thin air",
            "Start": "2017-01-01",
            "End": "2021-01-01"
          },
          {
            "BI_City": "Amsterdam",
            "BI_Sector": "Cars",
            "Source": "Thumb",
            "Start": "2011-01-01",
            "End": "2016-01-01"
          },
          {
            "BI_City": "Amsterdam",
            "BI_Sector": "Bikes",
            "Source": "Thin air",
            "Start": "2020-01-01",
            "End": "2026-01-01"
          },
          {
            "BI_City": "Amsterdam",
            "BI_Sector": "Bikes",
            "Source": "Thumb",
            "Start": "2019-01-01",
            "End": "2023-01-01"
          },
          {
            "BI_City": "Amsterdam",
            "BI_Sector": "Apples",
            "Source": "Thin air",
            "Start": "2020-01-01",
            "End": "2024-01-01"
          },
          {
            "BI_City": "Amsterdam",
            "BI_Sector": "Apples",
            "Source": "Thin air",
            "Start": "2006-01-01",
            "End": "2011-01-01"
          },
          {
            "BI_City": "Birningham",
            "BI_Sector": "Bikes",
            "Source": "Thin air",
            "Start": "2016-01-01",
            "End": "2021-01-01"
          },
          {
            "BI_City": "Birningham",
            "BI_Sector": "Apples",
            "Source": "Thumb",
            "Start": "1994-01-01",
            "End": "1998-01-01"
          },
          {
            "BI_City": "Copenhagen",
            "BI_Sector": "Cars",
            "Source": "Thin air",
            "Start": "2001-01-01",
            "End": "2005-01-01"
          },
          {
            "BI_City": "Copenhagen",
            "BI_Sector": "Cars",
            "Source": "Thin air",
            "Start": "2023-01-01",
            "End": "2029-01-01"
          },
          {
            "BI_City": "Copenhagen",
            "BI_Sector": "Bikes",
            "Source": "Thin air",
            "Start": "2001-01-01",
            "End": "2005-01-01"
          },
          {
            "BI_City": "Copenhagen",
            "BI_Sector": "Bikes",
            "Source": "Thumb",
            "Start": "2009-01-01",
            "End": "2013-01-01"
          },
          {
            "BI_City": "Denver",
            "BI_Sector": "Apples",
            "Source": "Thin air",
            "Start": "2015-01-01",
            "End": "2019-01-01"
          }
        ]
      },
      "width": 120,
      "spacing": 5,
      "mark": "bar",
      "encoding": {
        "x": {
          "field": "Start",
          "type": "temporal",
          "axis": {"grid": false, "domain": false},
          "title": null
        },
        "x2": {"field": "End", "title": null},
        "color": {
          "field": "Source",
          "type": "nominal",
          "legend": {"orient": "bottom", "titleOrient": "left"},
          "title": ""
        },
        "opacity": {"value": 0.5},
        "column": {
          "field": "BI_City",
          "title": "",
          "header": {"labelAngle": 0, "labelPadding": 0}
        },
        "row": {
          "field": "BI_Sector",
          "title": "",
          "header": {"labelAngle": 0, "labelPadding": 0}
        },
        "tooltip": [
          {"field": "BI_City", "type": "nominal"},
          {"field": "BI_Sector", "type": "nominal"},
          {"field": "Source", "type": "nominal"},
          {"field": "Start", "type": "temporal"},
          {"field": "End", "type": "temporal"}
        ]
      }
    }
    
    Login or Signup to reply.
Please signup or login to give your own answer.
Back To Top
Search