 Question posted in

I picked up a shape image for Germany from the web and transformed it to 50 points via https://spotify.github.io/coordinator/ The result is this
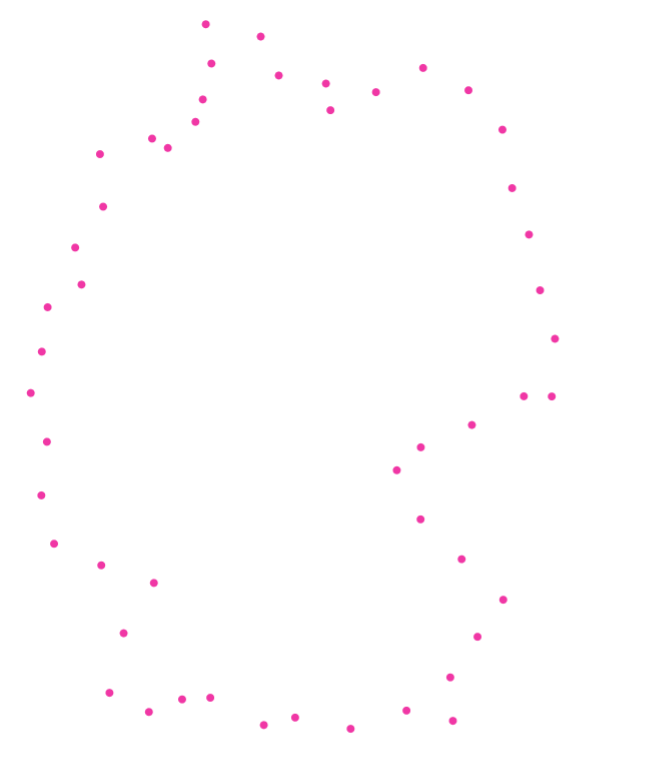
I also get the raw data from this site and like to recreate the point-shape of Germany in R. I read the json data and get x- and y-coordinates.
library(jsonlite)
library(tidyverse)

json_string <- '
[[540,332],[525.8673706054688,285.98309326171875],[515.3498840332031,233.10569763183594],[499.3660888671875,188.9991912841797],[490.1600341796875,133.55309295654297],[457.92767333984375,96.12726593017578],[414.88153076171875,74.93893814086914],[370.1520080566406,97.94972229003906],[326.9494934082031,115.06555938720703],[322.642333984375,89.7661361694336],[277.89208984375,82.11088180541992],[260.78253173828125,45.16008186340332],[208.6212615966797,33.503520011901855],[214.01766967773438,70.76221466064453],[205.77508544921875,104.86630249023438],[198.83863830566406,126.0848159790039],[172.58865356445312,150.8688201904297],[157.6624755859375,141.99374389648438],[108.19580078125,156.77096557617188],[111.21473693847656,206.62644958496094],[84.68843841552734,245.4501953125],[90.67401123046875,280.5671081542969],[58.516387939453125,302.04315185546875],[52.970733642578125,344.23388671875],[42.458900451660156,383.45556640625],[57.81577682495117,429.778076171875],[52.560577392578125,480.62005615234375],[64.63249969482422,526.5261535644531],[109.45503234863281,546.9636840820312],[159.35745239257812,563.7278442382812],[130.66680908203125,611.4195556640625],[117.22815704345703,668.0169677734375],[154.635986328125,686.1691284179688],[186.16036987304688,674.2149047851562],[212.90113830566406,672.6448364257812],[263.6999969482422,698.590087890625],[293.43646240234375,691.4788208007812],[346.10491943359375,702.1339111328125],[399.1070861816406,684.85009765625],[443.1532897949219,694.6134643554688],[440.6780090332031,653.3363647460938],[466.5060119628906,614.8057250976562],[490.922119140625,579.669189453125],[451.4901123046875,541.154541015625],[412.4823303222656,503.34405517578125],[389.91070556640625,456.73211669921875],[412.7138366699219,434.9665832519531],[461.1761169433594,413.793701171875],[510.49798583984375,386.5573425292969],[536.9722900390625,386.751953125]]'

parsed_data <- fromJSON(json_string)

df_points <- data.frame(x = parsed_data[, 1], y = parsed_data[, 2])

# Plot the points
ggplot(df_points, aes(x, y)) +
  geom_point() +
  theme_minimal()
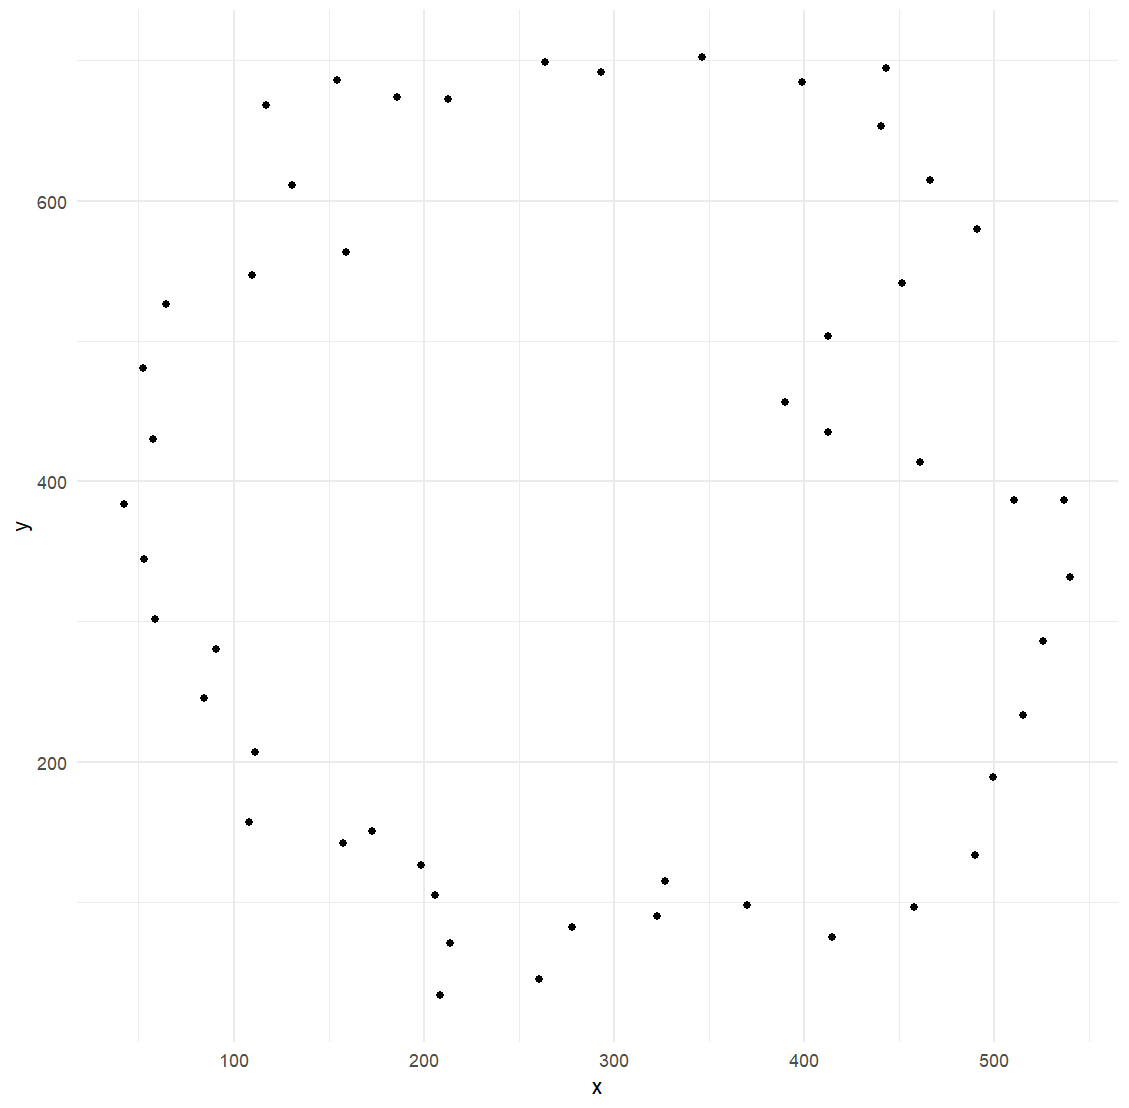
But my image looks like the x- and y-coordinates are reversed. How can I fix this?
2
Answers
Default coordinate system in Ggplot2 has its origin (0,0) as in the bottom-left corner, whereas your data seems to be using a coordinate system with the origin in the top-left corner, So use scale_y_reverse(), to reverse the y-axis in your ggplot to match the coordinate system of your data. updated code
Not the answer to question but the way how to do it in R directly. Let’s take area of Germany, convert it to linestring, sample around the boundary and plot it:
Created on 2024-01-04 with reprex v2.0.2