I configured PHP Xdebug with apache server and using Chrome. And it was working but then I played with other configuration and breakpoints stopped working.
So originally my working configuration is like this:
my php.ini:
[xdebug]
zend_extension="c:/wamp64/bin/php/php8.0.26/zend_ext/php_xdebug-3.2.2-8.0-vs16-x86_64.dll"
;xdebug.mode allowed are : off develop coverage debug gcstats profile trace
xdebug.mode =debug
xdebug.output_dir ="c:/wamp64/tmp"
xdebug.show_local_vars=0
xdebug.log="c:/wamp64/logs/xdebug2.log"
;xdebug.log_level : 0 Criticals, 1 Connection, 3 Warnings, 5 Communication, 7 Information, 10 Debug Breakpoint
xdebug.log_level=7
;VBE change: ;xdebug.profiler_output_name=trace.%H.%t.%p.cgrind
xdebug.profiler_output_name = "cachegrind.out.%t-%s"
xdebug.use_compression=false
xdebug.client_port = 9002
xdebug.client_host = localhost
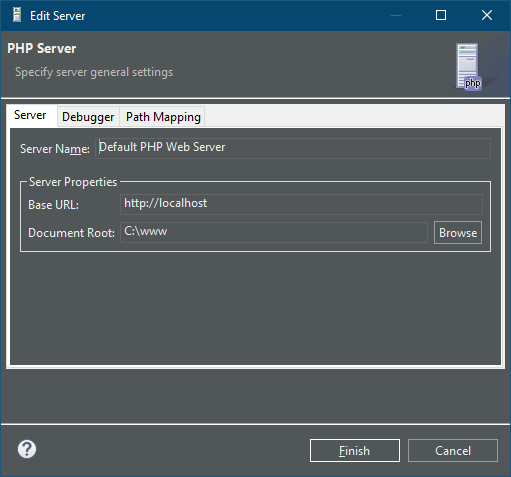
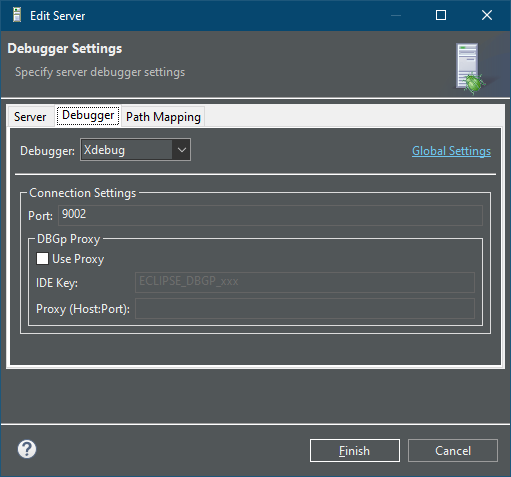
Window->Preferences->PHP->Server->Default PHP webserver
Server tab:
Debugger tab:
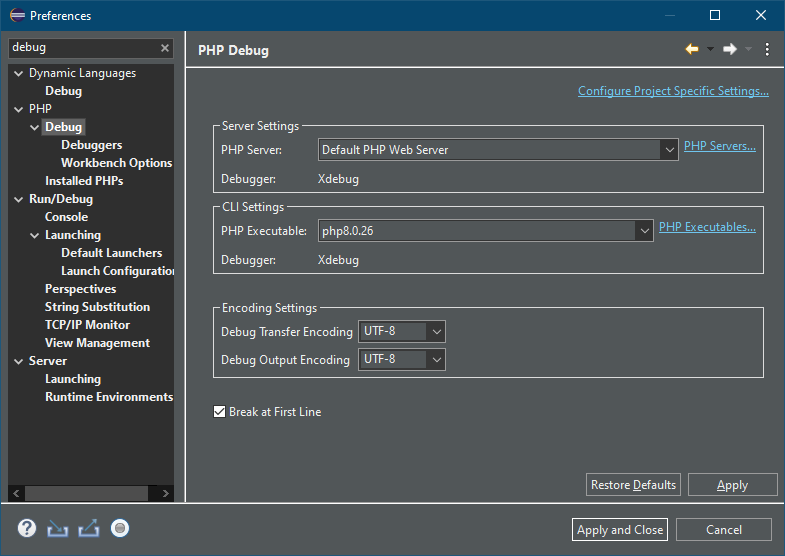
Window->Preferences->PHP->Debug
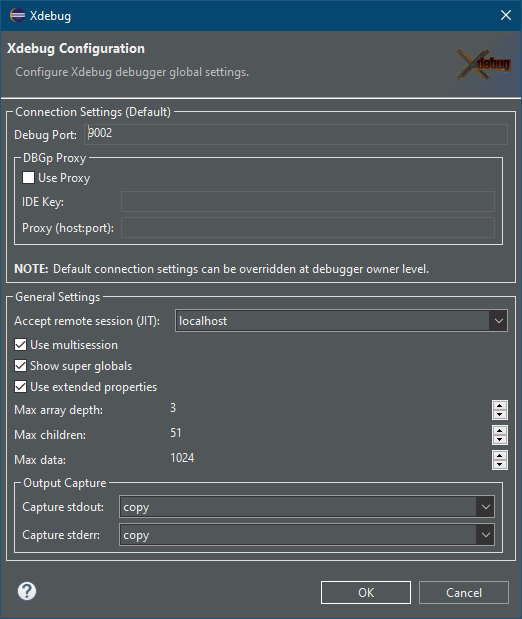
Window->Preferences->PHP->Debug->Debuggers->XDebug
Then I click Run->Debug as->PHP Web Application
Then it offers "Launch URL" dialog. I had to change path from
http://localhost/wp_leo/1/vbe_get_mem.php
to
http://localhost/3/1/vbe_get_mem.php
as Eclipse uses name of the project which is wp_leo but my actual path on server is just 3.
Then first time breakpoint worked. But then I played with configurations and at some point breakpoint stopped working. I got just "Break at first line" as it was checked in Window->Preferences->PHP->Debug. But all other breakpoints were ignored. So the question is why my breakpoints are ignored??????????


2
Answers
So after some eclipse crazy clicking I went to xdebug.log file. Searching for
breakpointand I got lucky there is commandbreakpoint_set. So I found:The path
/http://localhost/3/1/vbe_get_mem.php -n 18is actually correct path. But it does not work. I was wondering that maybefile:///andhttp://is weird combination. So I tried my debuger in CLI mode where breakpoint worked and there was used path:Which looks wild but was working. So
%5Cis used instead of/. My document root isc:/www/and path on server is3/1/vbe_get_mem.php.Actually one thing that I was trying to configure was mapping path. Because I didn't like that every new file I debugged offered wrong path using project name instead of actual path on server and I need to manually rewrite it... So I played with Window->Preferences->PHP->Servers->Default PHP Web Server->Tab "Path Mapping". And probably that was mistake. Solution was to delete everything there and make it empty. Like this:
then breakpoint started working. And the path in xdebug.log started looking same as in CLI mode:
Good luck...
Path mappings should be directories, not URIs (such as
http://).