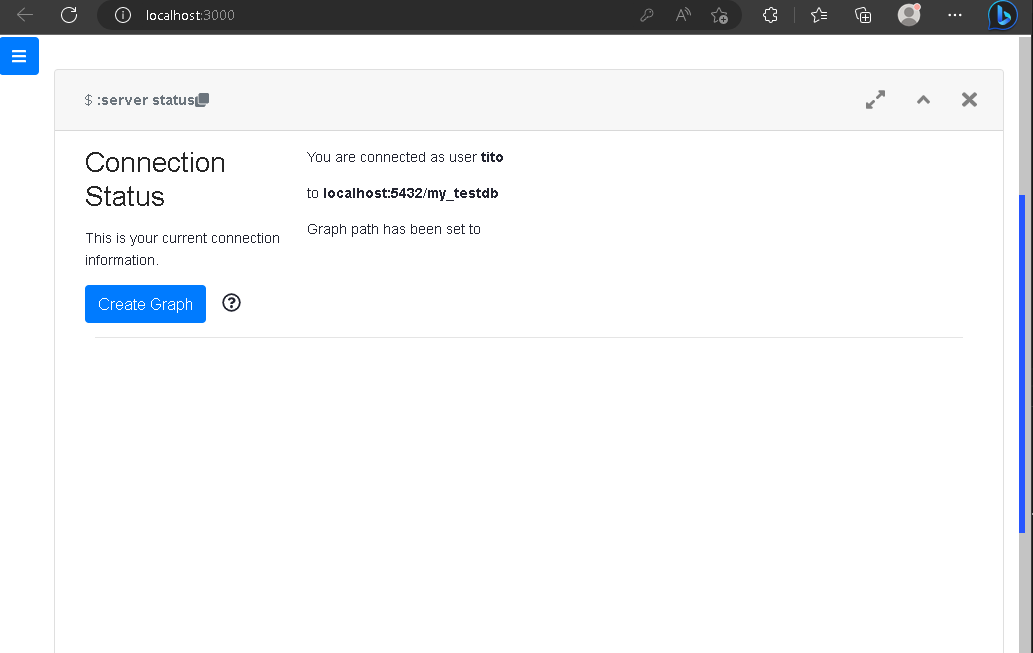
I am trying to visualize the queries of a graph created in AGE using AGE Viewer but I can’t see the graph I created. This is the issue
I followed the exact steps to visualizing a graph using
npm run setup
followed by
npm run start.
How can I solve this and make graph path display so I can easily visualize queries?


3
Answers
It looks like this is the standard screen for when you successfully connect your database to AGE Viewer. To visualize the edges, you need to go to the top of the screen where it will be a query bar and other options to select. There, you can select the
Current Graphthat you are working on and then type your queries in the query bar.Try populating the graph with nodes and edges and make sure it’s not empty.
If this doesn’t solve the problem, make sure that you cloned AGE viewer in the directory of the database you are currently using to visualize the graphs.
Also, I am not sure but your system but usually when we start AGE viewer, we get a screen that prompts us to enter information about database type, name | connection URL, path | username, password and some others. Make sure to fill them correctly to access the right graph.
In the prompt at the top of the page type your query and execute after that, the graph will appear.
A query example: