skip to Main Content

I can draw a spline using d3 without a problem.

<html>
<head>
    <script src="https://d3js.org/d3.v7.min.js"></script>
    <style>
        .graph-container {
            width: 100%;
            height: 800px;
            position: relative;
        }
    </style>
</head>
<body>
    <div id="graph-container" class="graph-container"></div>
    <script>
        // Define the data points for the spline curve
        const data = [
            { x: 0, y: 80, r: 12 },
            { x: 100, y: 100, r: 40 },
            { x: 200, y: 30, r: 6 },
            { x: 300, y: 50, r: 8 },
            { x: 400, y: 40, r: 10 },
            { x: 500, y: 80, r: 12 },
        ];

        // Set up the SVG container
        const svgWidth = 600;
        const svgHeight = 200;
        const svg = d3.select('#graph-container')  // Select the graph-container div
            .append('svg')
            .attr('width', svgWidth)
            .attr('height', svgHeight);

        // Create the spline generator
        const line = d3.line()
            .x((d) => d.x)
            .y((d) => d.y)
//            .curve(d3.curveMonotoneX);
            .curve(d3.curveCardinal);

        // Draw the spline curve
        svg.append('path')
            .datum(data)
            .attr('d', line)
            .attr('fill', 'none')
            .attr('stroke', 'green')
            .attr('stroke-width', (d) => d.r);
    </script>
</body>
</html>

enter image description here

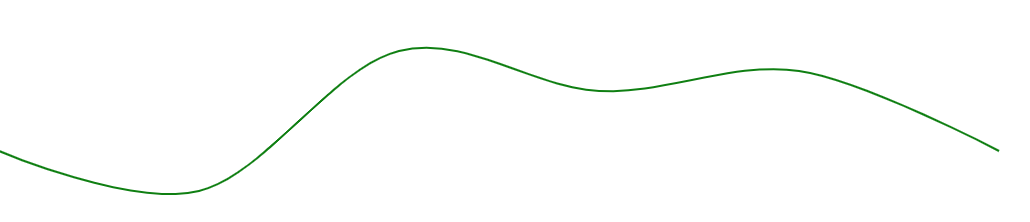
My problem is to draw each segment with a different thickness (stroke width). I want each line segment to transition to the next control point smoothly.

It seems that d3 .attr(‘stroke-width’, (d) => d.r) doesn’t work.
How can I do it in React JS?

Thanks,

2

Answers


  1. Here is a spline built as an approximated multiline:

    const data = [
      { x: 0, y: 80, r: 12 },
      { x: 100, y: 100, r: 30 },
      { x: 200, y: 30, r: 6 },
      { x: 300, y: 50, r: 8 },
      { x: 400, y: 40, r: 10 },
      { x: 500, y: 80, r: 12 },
    ];
    
    const rValueByX = (x) => {
        if (x === data[0].x) {
        return data[0].r;
      }
    
      const index = data.findIndex(item => item.x >= x);
      const prevX = data[index - 1].x;
      const nextX = data[index].x;
      const delta = (x - prevX) / (nextX - prevX);
      const prevR = data[index - 1].r;
      const nextR = data[index].r;
      return (nextR - prevR) * delta + prevR;
    }
    
    // Set up the SVG container
    const svgWidth = 600;
    const svgHeight = 150;
    const svg = d3.select('#graph-container')
      .append('svg')
      .attr('width', svgWidth)
      .attr('height', svgHeight);
    
    const line = d3.line()
      .x((d) => d.x)
      .y((d) => d.y)
      .curve(d3.curveCardinal);
                
    const path = svg.append('path')
      .attr('d', line(data))
      .attr('fill', 'none')
      .attr('stroke', 'green');
      
    const total = path.node().getTotalLength();
    const step = total / 100;
    
    for (let len = 0; len <= total; len += step) {
      const fromLen = Math.max(0, len - step);
      const toLen = Math.min(len + step, total);
      const point = path.node().getPointAtLength(len);
      const r = rValueByX(point.x);
      const from = path.node().getPointAtLength(fromLen);
      const to = path.node().getPointAtLength(toLen);
      
      svg.append('line')
        .attr('x1', from.x)
        .attr('y1', from.y)
        .attr('x2', to.x)
        .attr('y2', to.y)
        .attr('stroke-width', r)
        .attr('stroke', 'green');
    }
    <script src="https://d3js.org/d3.v7.min.js"></script>
    <div id="graph-container"/>
    Login or Signup to reply.
  2. Based on Michael Rovinsky’s rValueByX() interpolation helper you could also draw 2 Splines and concatenate them.

    let data = [
      { x: 0, y: 80, r: 12 },
      { x: 100, y: 100, r: 30 },
      { x: 200, y: 30, r: 6 },
      { x: 300, y: 50, r: 8 },
      { x: 400, y: 40, r: 10 },
      { x: 500, y: 80, r: 12 }
    ];
    
    function rValueByX(x) {
      if (x === data[0].x) {
        return data[0].r;
      }
      const index = data.findIndex((item) => item.x >= x);
      const prevX = data[index - 1].x;
      const nextX = data[index].x;
      const delta = (x - prevX) / (nextX - prevX);
      const prevR = data[index - 1].r;
      const nextR = data[index].r;
      return (nextR - prevR) * delta + prevR;
    }
    
    // Set up the SVG container
    const svgWidth = 600;
    const svgHeight = 150;
    // last index
    const dataL = data.length-1;
    
    const svg = d3
      .select("#graph-container")
      .append("svg")
      .attr("width", svgWidth)
      .attr("height", svgHeight);
    
    const lineTop = d3
      .line()
      .x( d => d.x)
      .y( d => {
        return d.y - rValueByX(d.x) / 2;
      })
      .curve(d3.curveCardinal);
    
    
    const lineBottom = d3
      .line()
      .x((d, i) => data[dataL-i].x)
      .y( (d,i) => data[dataL-i].y + rValueByX( data[dataL-i].x ) / 2)
      .curve(d3.curveCardinal);
    
    const lineMiddle= d3
      .line()
      .x( d => d.x)
      .y( d => d.y )
      .curve(d3.curveCardinal);
    
    
    const path = svg
      .append("path")
      // concatenate paths
      .attr("d", lineTop(data) + (lineBottom(data).replaceAll('M', 'L') +'z' ) )
      .attr("fill", "green")
      .attr("fill-opacity", "0.5");
    
    
    const pathMiddle = svg
      .append("path")
      .attr("d", lineMiddle(data))
      .attr("fill", "none")
      .attr("stroke", "green");
    <script src="https://d3js.org/d3.v7.min.js"></script>
    <div id="graph-container" />

    We’re actually drawing an upper and a bottom spline using an y offset according to the current r stroke radius.

     const lineTop = d3
      .line()
      .x( d => d.x)
      .y( d => {
        return d.y - rValueByX(d.x) / 2;
      })
      .curve(d3.curveCardinal);
    
    
    const lineBottom = d3
      .line()
      .x((d, i) => data[dataL-i].x)
      .y( (d,i) => data[dataL-i].y + rValueByX( data[dataL-i].x ) / 2)
      .curve(d3.curveCardinal);  
    

    The bottom spline needs to reverse the data coordinates.
    Then we can concatenate both splines to a single path:

    const path = svg
      .append("path")
      // concatenate paths
      .attr("d", lineTop(data) + (lineBottom(data).replaceAll('M', 'L') +'z' ) )
      .attr("fill", "green")
      .attr("fill-opacity", "0.5");
    

    The benefit of this approach – we don’t need to approximate the shape by many <line> elements.

    Worth mentioning: Hundreds of getPointAtLength() calls can significantly impact rendering performance.

    Login or Signup to reply.
Please signup or login to give your own answer.
Back To Top
Search