


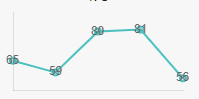
I’m using chartJs line chart for my react application. It has shown the data values(65, 59, 80 etc in my chart) on the line chart. Is it possible to remove or hide those values?
here is my code
const data = {
    labels: ['January', 'February', 'March', 'April', 'May'],
    datasets: [
      {
        label: '',
        data: [65, 59, 80, 81, 56],
        borderColor: 'rgba(75, 192, 192, 1)',
        borderWidth: 2,
        fill: false,
        pointStyle: 'hidden', // Hide data points on the chart
      },
    ],
  };

  const options = {
    scales: {
      x: {
        grid: {
          display: false, // Remove x-axis grid lines
        },
        ticks: {
          display: false, // Hide x-axis labels
        },
      },
      y: {
        grid: {
          display: false,
        },
        ticks: {
          display: false, // Hide x-axis labels
        },
      },
    },
    plugins: {
      legend: {
        display: false,
      },
      tooltips: {
        enabled: false, // Hide data values on hover
      },
    },
  };

<Line data={data} options={options} />
thank you
2
Answers
I found this and it's working for me
hiddenis not a valid option for the Point Style.You should use the boolean
falseto disable them: