


Plots in matplotlib are not showing-up in a Jupyter Notebook in Visual Studio Code.
I cannot see plots that I am trying to generate inside of a notebook -or- the plots that were already created inside of a Jupyter Notebook by someone else. The plot is not visible inside the notebook. These are .ipynb files.
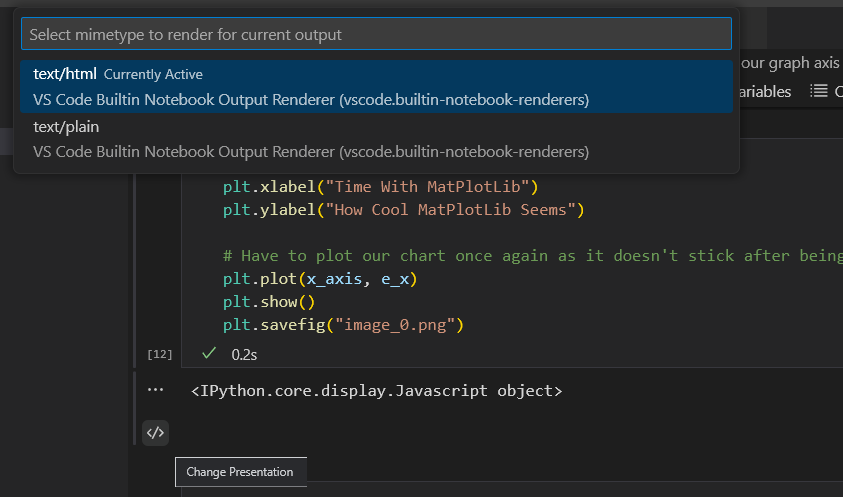
Instead of seeing the plots, I see this:
html version
html version
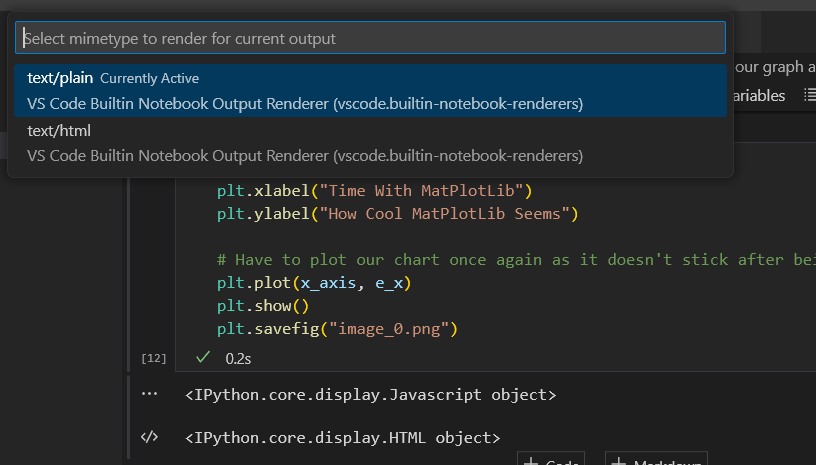
plain version
plain version
Matplotlib is creating the plot; I just cannot see it in the notebook. My guess is that this is an issue in visibility for Jupyter Notebooks in Visual Studio Code.
Below is an example code that I am working with to troubleshoot the issue. Please keep in mind that this is happening for all notebooks, not this code. The code includes some methods that I have tried, unsuccessfully, to get the plots to show up.
# Import Numpy for calculations and matplotlib for charting

# %matplotlib notebook
%matplotlib inline
# %matplotlib ipympl

import numpy as np
import matplotlib.pyplot as plt
from IPython.display import Javascript, display

# Creates a numpy array from 0 to 5 with each step being 0.1 higher than the last
x_axis = np.arange(0, 5, 0.1)
x_axis

# Creates an exponential series of values which we can then chart
e_x = [np.exp(x) for x in x_axis]
e_x

# Create a graph based upon the list and array we have created
plt.plot(x_axis, e_x)
# Show the graph that we have created
plt.show()

# Give our graph axis labels
plt.xlabel("Time With MatPlotLib")
plt.ylabel("How Cool MatPlotLib Seems")

# Have to plot our chart once again as it doesn't stick after being shown
plt.plot(x_axis, e_x)
plt.show()
plt.savefig("image_0.png")
I have tried several things that I have found in various places online, but with no success:
-
Restarted Kernel, and Run All again. Closing Visual Studio Code, reopening, and trying again. Restarting my computer, and trying it again.
-
Check the version:
python 3.11.3
matplotlib 3.7.1, backend ‘nbAgg’
numpy 1.24.2
Jupyter extension from Microsoft v2023.3.1201040234
Visual Studio Code ‘There are currently no updates available.’ -
Add in %… statements. I have run these individually and in combination with each other. No luck.
Insert%matplotlib notebookat the start of the code.
Insert%matplotlib inlineat the start of the code.
Insert%matplotlib ipymplat the start of the code.
Insert%matplotlib inlinebefore plot with the issue.
Insert%matplotlib inlinetwice before the plot with the issue. -
Export the plot as an image.
Save the plot as an image usingplt.savefig("image_0.png")This was hit-and-miss for me. Currently, this is exporting the plot to a file correctly, suggesting that matplotlib is creating the plot, but something is happening which is resulting in the plot not being visible in the notebook itself. -
Settings
In Settings (File > Preferences > Settings), searched for ‘matplotlib’ and enabled setting "In the Interactive window and Notebook Editor theme matplotlib outputs to match the VSCode editor theme. I have tried this with and without this enabled. -
I don’t know, maybe this will work?
Add print aroundplt.show().
Importfrom IPython.display import Javascript, displayand runJavascript(plt.show()).
3
Answers
Below is what seemed to work for me. It is a simple solution, and I am not sure if any of the other methods that I attempted also contributed to this working.
Click on the three dots next to where the image should be, and select 'Change Presentation'. (Note: Not the '</>' if present; look for three dots.)
A pop-up should appear asking for the presentation type: image or plain. Choose 'image/png'.
That's it!
plt.show()will now show the figure in the notebook after this. This setting appears to be working across all of my notebooks without me having to do this update on each notebook.If I were you, I would try updating matplotlib:
pip install matplotlib --upgradeYou may also see something like this:
https://i.stack.imgur.com/kZJpB.png
If you see that, click the </>.
If that doesn’t work, as a last resort I’d recommend reinstalling vscode.
plt.show()need to be added afterplt.savefig()