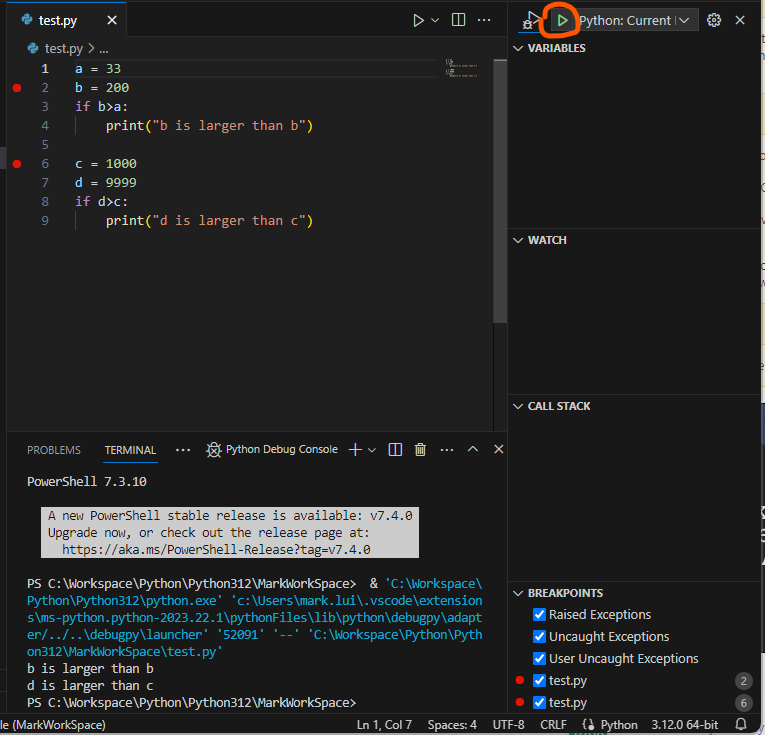
I am trying to learn how to use break points.
As you can see in below screenshot, the program didn’t stop at break point and the variables window is empty.
I press the button in orange circle. I have also tried press F5 Start debugging. Both have same result.
What could be the problem?
Here is my code. There is no error message. The program run from line 1 to line 9 without error.
a = 33
b = 200
if b>a:
    print("b is larger than b")

c = 1000
d = 9999
if d>c:
    print("d is larger than c")
Here is my debug configuration launch.json
{
    // Use IntelliSense to learn about possible attributes.
    // Hover to view descriptions of existing attributes.
    // For more information, visit: https://go.microsoft.com/fwlink/?linkid=830387
    "version": "0.2.0",
    "configurations": [
        {
            "name": "Python: Current File",
            "type": "python",
            "request": "launch",
            "program": "${file}",
            "console": "integratedTerminal",
            "justMyCode": true
        }
    ]
}


4
Answers
I don't know the true cause but I found a workaround.
I create a Jupyter Notebook (test.ipynb) then copy my code to one of the cell. Then I press "Debug Cell" as in below screen capture. Then the debug mode and breakpoints are working as expected.
You are placing the stop in the loop line. If you want to check the values before it enters and does the whole loop, you need to place it in the line before, if not, you are stopping the debug in the loop exit, and you program ends when your loop ends.
Looking at the file paths, you have created a VSC workspace directory with the
test.pyfile INSIDE the python interpreter directory with thepython.exe.First place the VSC workspace OUTSIDE the python interpreter directory.
Your file
test.pyis seen as part of the python libs, it is INSIDE the python interpreter directory, you have thejustMyCode:trueIt seems that you create a working area in the Python directory.
Modifying launch.json
justMyCodevalue tofalsecan make debugging stop at the breakpoint.But the correct approach should be to create a working area outside the Python directory.