


I am trying to debug my python program with the use of the below launch.json configuration.
{
    "name": "pysystemtrade",
    "type": "python",
    "request": "launch",
    "program": "/Users/darshildholakia/Documents/pysystemtrade/examples/introduction/prebakedsystems.py",
    "justMyCode": false,
    "subProcess": true,
},
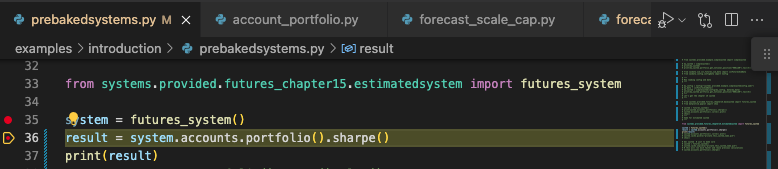
Here, I’ve specified path/to/prebakedsystems.py as the entrypoint as that is the file that kicks off all the processes in this program. I’ve included a screenshot (same bit of code shown right below the screenshot) of the debugger working fine in the prebakedsystems.py file but when I click continue when I’m at line 36, it doesn’t go to the breakpoint I’ve put in the system.accounts.portfolio() method. Any ideas on why this is happening and how I can fix it?
from systems.provided.futures_chapter15.estimatedsystem import futures_system

system = futures_system()
result = system.accounts.portfolio().sharpe()
print(result)
As a side note I have also tried stepping over and into when I am at line 36 of the screenshot and neither work. I have also tried setting "justMyCode" key to false and true, neither allow me to go to the breakpoint I have set in the system.accounts.portfolio() method.
2
Answers
Figured out the correct launch.json configuration which now allows me to debug throughout the entire system if anyone else is coming across this issue too please see below.
The new launch.json configuration needs to be:
}
First you need to start debugging using the green triangle button in the Run and Debugging panel, this will use the configuration in launch.json.
Then you can use
Step Intoaction. https://code.visualstudio.com/docs/editor/debugging#_debug-actionsThis may also have something to do with your file structure, so if it still fails, please add more information. You can see how to ask and minimal reproducible example