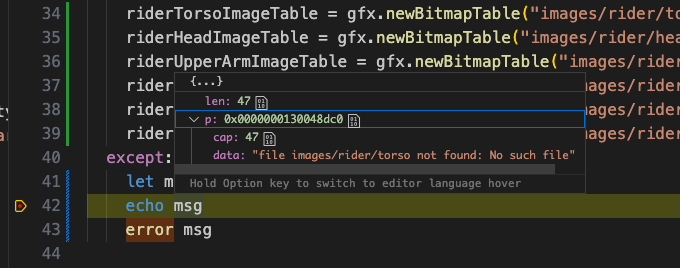
I’m debugging a C app in VS Code on Mac OS (arm64).
I can set breakpoints and see stacktraces. However, for variables, memory addresses are shown instead of values. The variable I want to inspect is msg. Whether I add a "watch", type its name in the lldb command prompt or hover the variable in the code editor, I always have to expand the p property in the result to see the value. Assuming p stands for pointer. A minor inconvenience, but can this be improved?
desired: when hovering msg, I see it’s value, like "file not found"
actual: I need to click "{…}" in the hover, then expand p to see the value
The source language I am coding in is Nim, which transpiles to C.
launch.json
{
    // Use IntelliSense to learn about possible attributes.
    // Hover to view descriptions of existing attributes.
    // For more information, visit: https://go.microsoft.com/fwlink/?linkid=830387
    "version": "0.2.0",
    "configurations": [
        {
            "type": "cppdbg",
            "request": "launch",
            "name": "Debug PDX",
            "program": "${env:PLAYDATE_SDK_PATH}/bin/Playdate Simulator",
            "args": [
                "${workspaceFolder}/${workspaceFolderBasename}.pdx"
            ],
            "cwd": "${workspaceFolder}",
            "osx": {
                "MIMode": "lldb",
                "program": "${env:PLAYDATE_SDK_PATH}/bin/Playdate Simulator.app"
            },
//[..]

 Question posted in


2
Answers
This is an elaboration on the answer by @Jim Ingham which pointed me in the right direction
This can be done by adding a type summary formatter.
First, I had to get hold of an lldb console. The
Debug Consoledoes not show that by default.Install the CodeLLDB plugin
To use this debugger, change the launch configuration to
(note that type is
lldbThe initCommands is useful if you want to keep your config inside your project.
Now let's create that config in your project: Create a file called
.lldbinitin your project root, and add the following:You should be able to launch the debug configuration, and the Debug Console should show something like
Now place a breakpoint after a line of code that sets a string value, and the mouse hover and Variables view of vscode should show the actual string value
lldb’s "summary formatters" are probably what you want. They allow you to present a "one line summary" for a data type, which you can see without having to disclose the type.
You can do what you want with a simple string summary like
${var.data%S}. You register that in your ~/.lldbinit using thetype summary addcommand. There’s lots more about how to use lldb summary formatters here:https://lldb.llvm.org/use/variable.html#type-summary