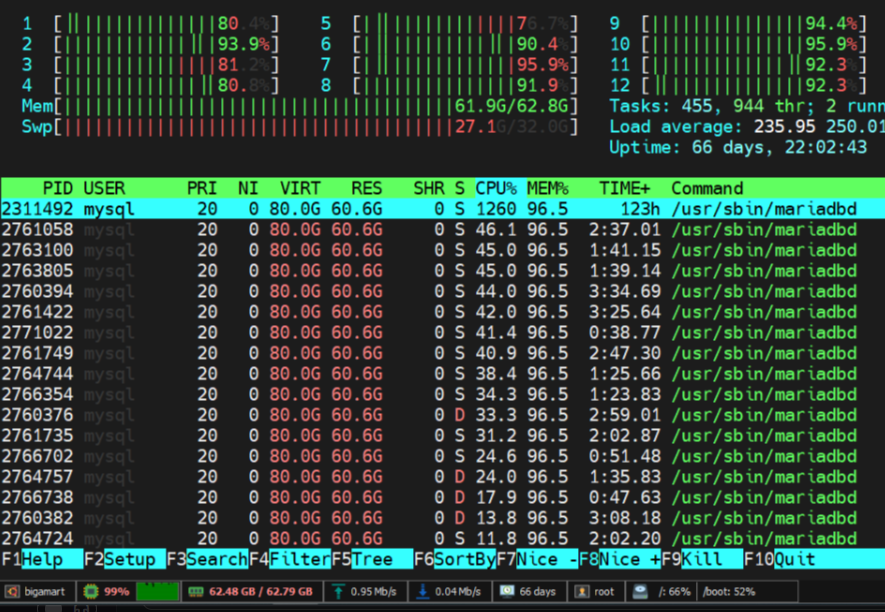
I have a Woo website with like 1 million product, type simple. (are they too many for a Woo website?)
Code and database are on same server
Server: 16 cores and 62 GB RAM.
MariaDB: mysql Ver 15.1 Distrib 10.5.23-MariaDB, for debian-linux-gnu (x86_64) using readline 5.2
Sometimes the CPU gets full and website becomes unresponsive.
I can see via htop MariaDB taking all of CPU.
It has CLoudflare installed.
Access logs shows traffic to /wp-json/wp/v2/product/ID-HERE endpoints from amazonbot, example.
162.158.87.126 - - [03/Feb/2024:15:52:35 +0100] "GET /wp-json/wp/v2/product_tag/766 HTTP/2.0" 504 164 "-" "Mozilla/5.0 (Macintosh; Intel Mac OS X 10_10_1) AppleWebKit/600.2.5 (KHTML, like Gecko) Version/8.0.2 Safari/600.2.5 (Amazonbot/0.1; +https://developer.amazon.com/support/amazonbot)" "3.224.220.101,3.224.220.101"
Does that make sense? or should I disable Woo API at all because I dont use it for any purpose.
SHOW PROCESSLIST shows these kind of queries hung for over 2000 seconds
SELECT
    post_modified_gmt
FROM
    wp_posts
WHERE
    post_status = 'publish'
    AND post_type IN ( 'post', 'page', 'attachment', 'e-landing-page', 'elementor_library', 'product' )
ORDER BY
    post_modified_gmt DESC
    LIMIT 1
and
SELECT
    wp_posts.ID
FROM
    wp_posts
    LEFT JOIN wp_term_relationships ON ( wp_posts.ID = wp_term_relationships.object_id )
WHERE
    1 = 1
    AND ( wp_term_relationships.term_taxonomy_id IN ( 2, 3, 4, 5 ) )
    AND wp_posts.post_type = 'product'
    AND ((
            wp_posts.post_status = 'publish'
        ))
GROUP BY
    wp_posts.ID
ORDER BY
    wp_posts.post_date DESC
    LIMIT 0,
    1
I have following INDEXes
wp_posts
wp_postmeta
wp_term_relationships
EDIT in response to Wilson
-
SELECT COUNT(*) FROM information_schema.tables;+———-+
| COUNT(*) |
+———-+
| 602 |
+———-+
1 row in set (0.004 sec) -
SHOW GLOBAL STATUS;https://pastebin.com/UnCJ3Hr3 -
STATUS;https://pastebin.com/2JMRL51B -
SHOW ENGINE INNODB STATUS;https://pastebin.com/Ze69SqLw -
top -b -n 1https://pastebin.com/EqFuchH4 -
top -b -n 1 -Hhttps://pastebin.com/aqx8rrvs -
ulimit -ahttps://pastebin.com/T0HT5Afh -
iostat -xm 5 3https://pastebin.com/nE3AwTvQ -
free -hhttps://pastebin.com/ND3E4iR8 -
cat /proc/meminfohttps://pastebin.com/ehGtav7F -
lsb_release -ahttps://pastebin.com/RZj2FFFz -
SHOW GLOBAL VARIABLES;https://justpaste.it/baovl -
SELECT COUNT(*), sum(data_length), sum(index_length), sum(data_free) FROM information_schema.tables LIMIT 100000;https://pastebin.com/RYs0u9dj
Everything is provided except htop as its already in screenshot above.
PS: during the all things I provided, the CPU never exceeded 80%, and average load was around 60%


2
Answers
Rewrite the first query as
and have this "covering" index:
You are using 10.5. The "191 kludge" is no longer needed as of MariaDB 10.2.2 (MySQL 5.7.7). Removing that "prefixing" form serveral of the indexes it will help many queries.
Rate Per Second = RPS
Suggestions to consider for your OS adjustment and my.cnf [mysqld] section
Your ulimit -a report indicates Open Files limit is 1024.
From your OS Command Prompt,
my.cnf [mysqld] suggestions,
There are many more performance improving opportunities. Please view profile.