Many questions have been asked before about overlaying multiple plots in ggplot. However, my question is slightly different.
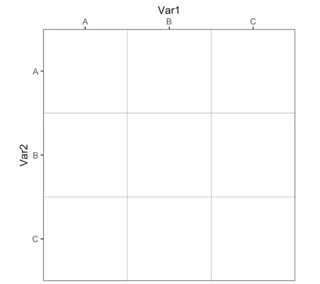
Basically, I am trying to plot a list of ggplot objects at specific coordinates on a graphic of a grid (that is created using ggplot). Hopefully my example below will explain more clearly.
To begin, create some data:
set.seed(100)
m <- matrix(runif(9, -1, 1), ncol = 3)
rownames(m) <- colnames(m) <- LETTERS[1:3]
m[lower.tri(m)] = t(m)[lower.tri(m)]
diag(m) <- 0
col1 <- colorRampPalette(RColorBrewer::brewer.pal(10,"BrBG"))
Then Im reshaping the data and creating the grid graphic to match the size of my data matrix:
df <- reshape2::melt(m)
df$abs <- abs(df$value)
df$Var1 <- factor(df$Var1, levels = colnames(m))


ggrid <- ggplot(df, aes(x = Var1, y = Var2, fill = value)) +
  geom_tile(aes(width = 1, height = 1), fill = NA, color = "grey50") +
  scale_x_discrete(position = "top", expand = c(0, 0)) +
  scale_y_discrete(limits = rev(levels(df$Var1)), expand = c(0, 0)) +
  theme_bw() +
  theme(
    aspect.ratio = 1,
    panel.grid = element_blank()
  )
The above code creates this:
Then I am creating a list of plots (in this case multiple pie charts).
plot_list <- list()
for(i in 1:9){
 plot_list[[i]] <-  ggplot(df, aes(x = "", y = value, fill = Var1)) +
   geom_col(color = "black") +
   coord_polar(theta = "y") +
   theme_void() +
   theme(legend.position = 'none')
}
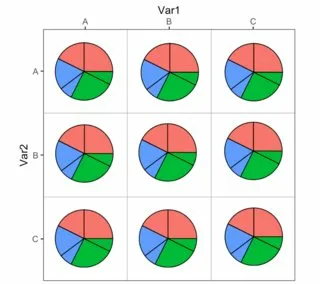
So, now the plot_list object contains 9 ggplot pie charts. What I’m trying to do is place the pie charts in the appropriate position on the grid. For example, plot_list[[1]] would be in position A,A on the grid… plot_list[[2]] -> A,B…continuing row-wise.
Any suggestions as to how I could achieve this. Ideally, my final goal is to make this work generically (that is, for any size grid/number of pie charts)
EDIT: To clarify, I would like my output to look like this (which I made in photoshop):
That is, I’m trying to place each pie chart in the appropriate place on top of the ggrid object.


2
Answers
You can use ggmatrix from GGally.
Created on 2023-04-24 with reprex v2.0.2
One option to add your pie charts on top of your
ggridplot would be to useannotation_custom. To this end I first create a dataframe containing the numeric positions to place the pies and the plots as another column. Afterwards you could use e.g.purrr::pmapto loop over the rows of this df and add the pies using multipleannotation_customlayers: